MSFT 4-day bearish forecast — Nov 1, 2026
- Bias: Bearish
- Timeframe: 4 days (made Nov 1, 2026, target date Nov 4, 2026)
- Price at analysis: $521.90
- Price target: $518.50
- Expected range: $508.50 – $529.00
- Result: Incorrect (+6.3%) — closed at $554.59 on Nov 4, 2026; quality score 0/100
Get a free AI analysis of MSFT today
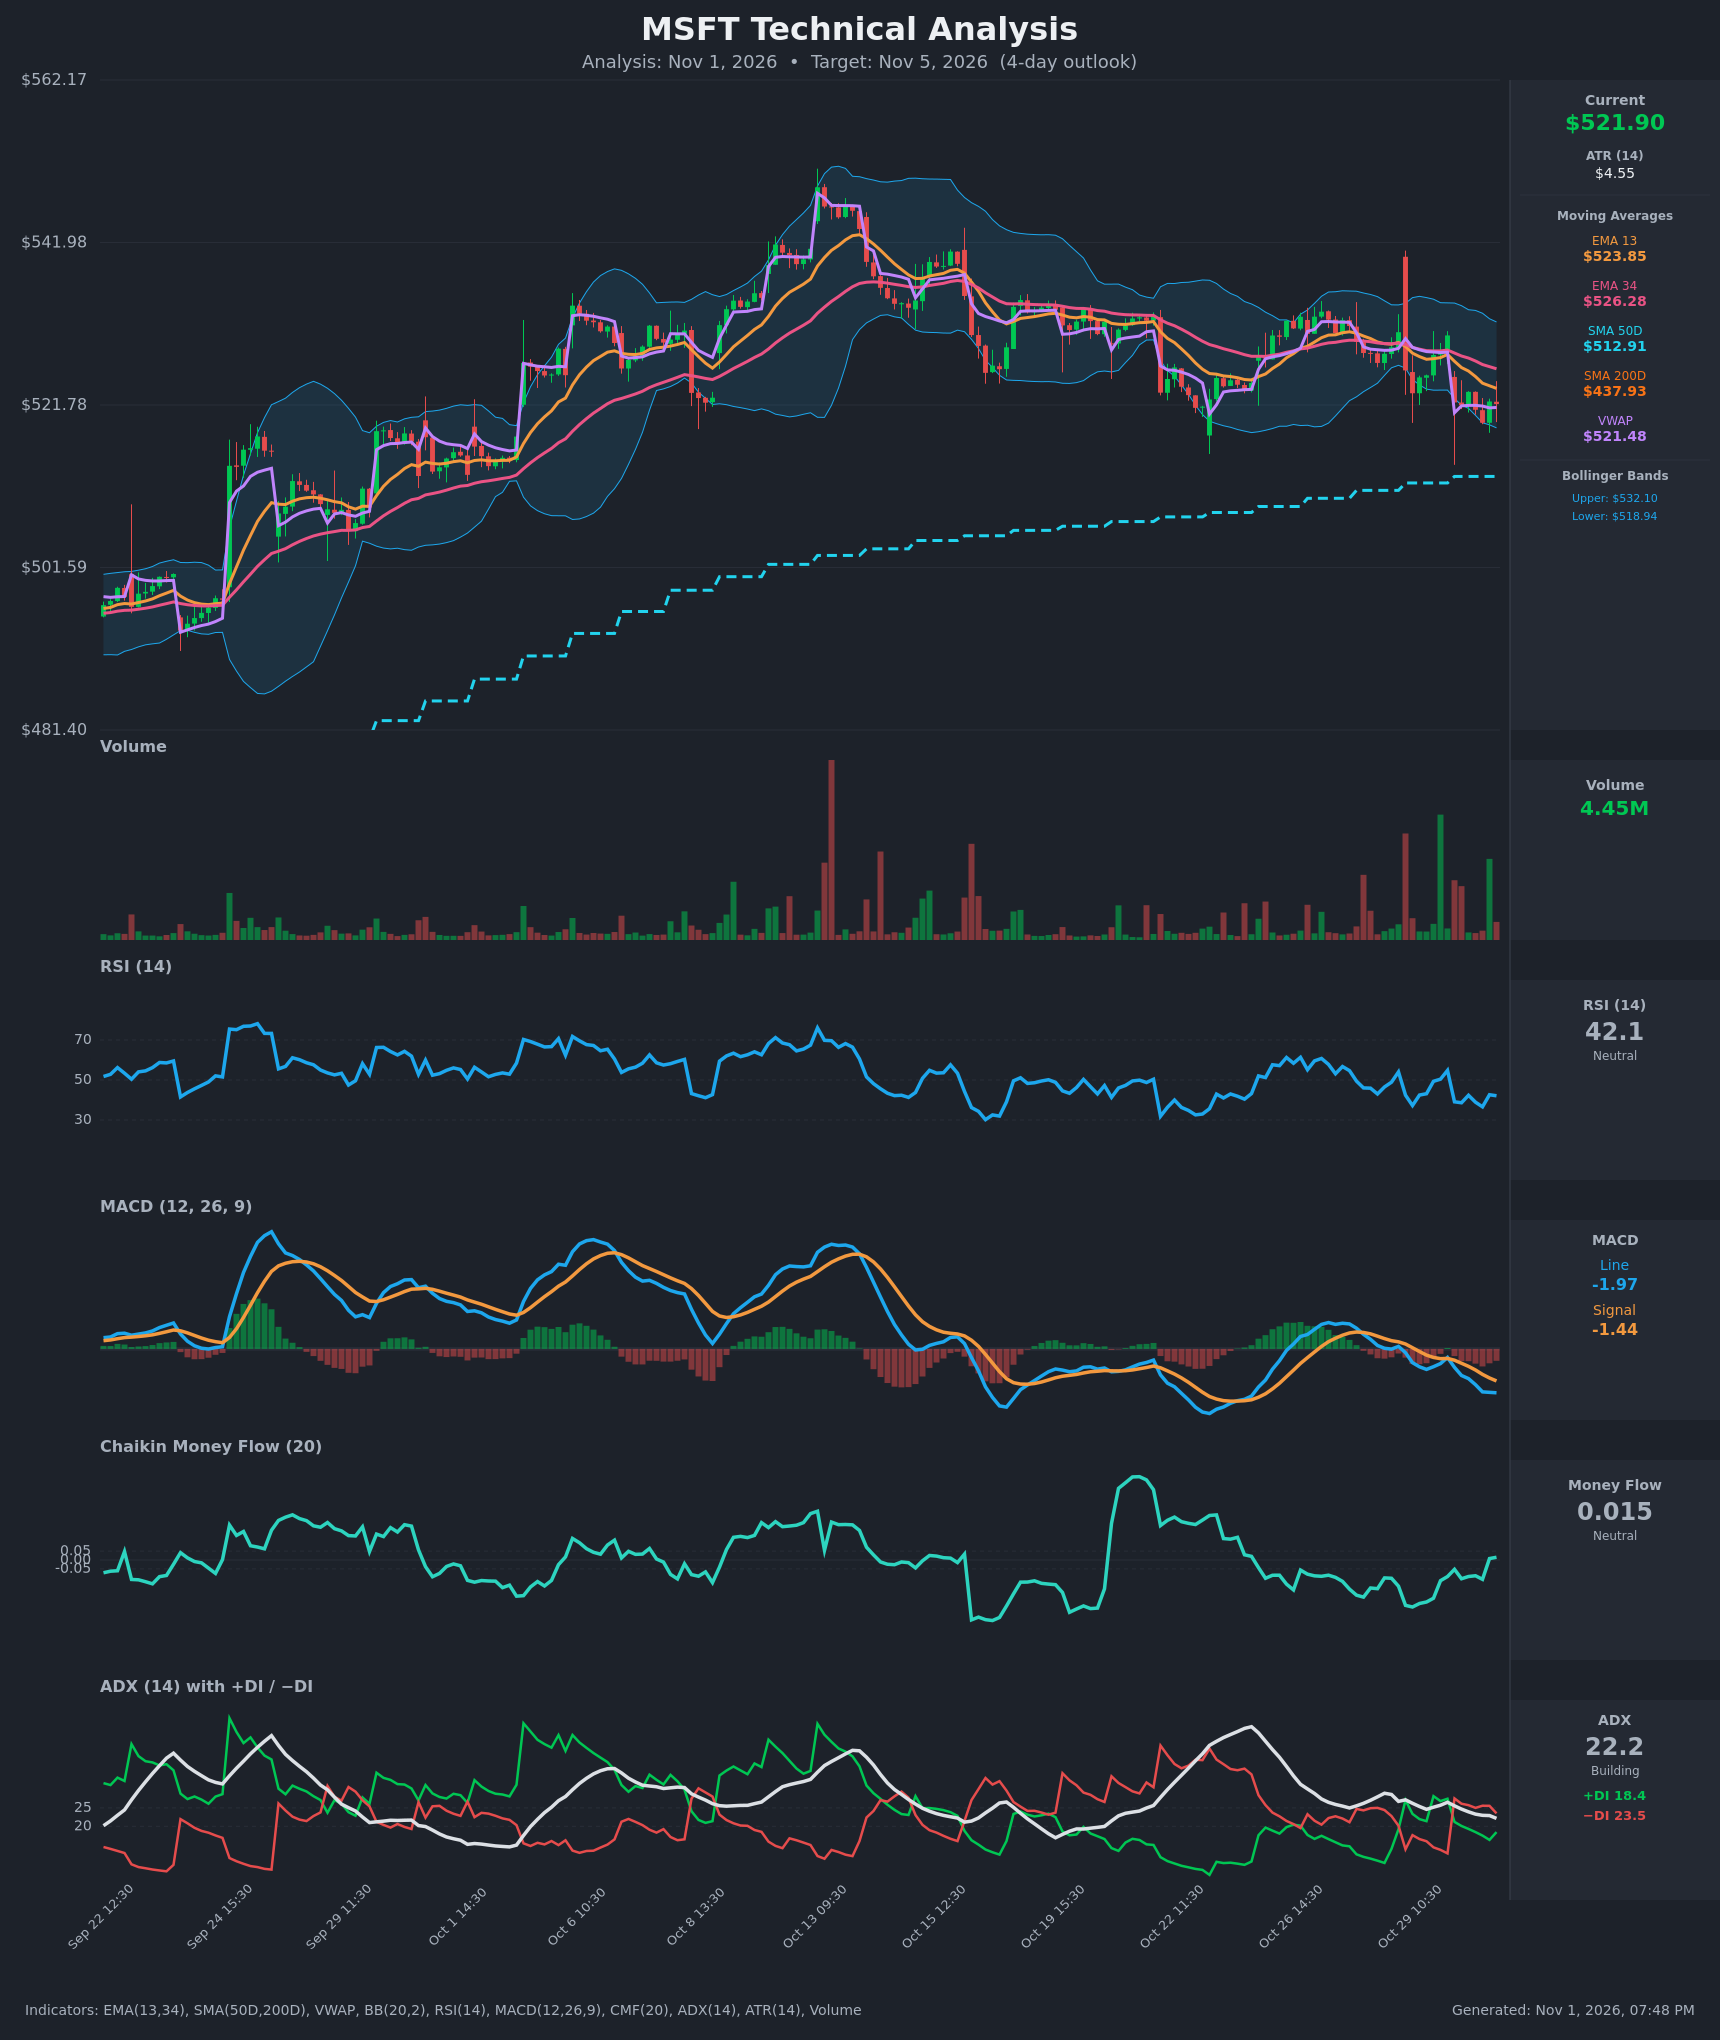
Analysis
TECHNICAL INDICATORS
- RSI (14): 42.1, below the 50 midline and sliding after a failed bounce toward 55 on Oct 29. It is not oversold (<30), and recent lows near 37-39 show sellers keep capping rallies. [Bearish]
- 20 EMA: Using the provided EMA 13 ($523.85) and EMA 34 ($526.28), price at $521.90 is below both. The EMAs are sloping down, with EMA 13 below EMA 34 since late Oct 29, so they act as overhead resistance. [Bearish]
- MACD: Line -1.97 is below signal -1.44 with a widening negative histogram. The bearish crossover happened on Oct 29, and the line is making new lows for the move. [Bearish]
- Bollinger Bands (20): Upper $532.10, lower $518.94, middle about $525.5. Price sits in the lower third, about $3 above the lower band, and the bands are narrowing. Price is below the midline, but it has not broken out of the bands. [Neutral]
- CMF (20): 0.015, back to the neutral zone after readings of -0.1 to -0.26 earlier in the week. Selling pressure is easing, but there is no real accumulation yet. [Neutral]
- ADX (14): 22.2 and fading from 27. −DI (23.5) is above +DI (18.4) after the Oct 30 bearish DI crossover. The trend is weak-to-moderate with a mild bearish lean. [Weak Trend, Bearish lean]
- Volume: 4.45M, average with no clear expansion. Heavy red volume spikes appeared on recent sell-offs (the Oct 29-30 gap-down opens), so distribution on down moves outweighs buying on bounces. [Mildly Bearish]
DIVERGENCES & TRENDS
- No clear divergence. RSI and MACD both confirm the lower highs in price from the mid-Oct peak near $545-550.
- Price has been making lower highs and lower lows since the peak. The recent bounce failed at the EMA 13/34 cluster near $524-526.
- The MACD bearish crossover (Oct 29) is still widening, and the DI cross to −DI dominance (Oct 30) confirms it.
- Price is still well above SMA50D ($512.91) and SMA200D ($437.93), so the long-term uptrend is intact and this looks like a pullback within it. SMA50D is the main support below.
- Price is hugging VWAP ($521.48), so it is balanced around the session's fair value, with a slight bearish tilt from the opening gap-downs.
- CMF recovering to neutral is a minor offset that argues against a sharp drop.
CHART PATTERNS
- The closest reference pattern is a Bearish Rising Wedge / Bearish Flag-style correction after the peak. Price is making lower highs under falling EMAs with MACD rolling over. It is not a textbook match.
- Another read is a Descending Triangle with flat support near $519-520 (lower Bollinger Band and recent intraday lows) and lower highs above. A break below $519 would project toward $512-513, near SMA50D.
- Intraday gap-downs at the open (Oct 29 and Oct 30) show repeated supply at $526-530.
- Over 4 days the pattern is a mild-bearish range, with $519 as the key trigger.
POTENTIAL SCENARIOS
- Scenario 1: Bearish Break of Support Toward SMA50D — Sellers keep defending the EMA cluster and price loses the lower Bollinger Band as MACD and −DI stay in control. Trigger: close below $518.90. Target: $513-515, near SMA50D. Invalidation: close above $526.30 (EMA 34). (45% probability)
- Scenario 2: Neutral Range Chop — Price stays between the lower band and the EMAs as ADX stays near 20 and CMF stays flat. Trigger: holds $518.90-$525. Target: $519-$525. Invalidation: a decisive close outside that range. (30% probability)
- Scenario 3: Bullish Mean-Reversion Bounce — Price bounces off the lower band as CMF turns positive and RSI recovers above 50. Trigger: close above $524 (EMA 13), then $526.30. Target: $528-$530. Invalidation: close below $518. (25% probability)
PRICE TARGETS
For the 4-day timeframe (Nov 5, 2026):
- Target Price: $518.50
- Expected Range: $508.50 to $529.00 (width $20.50, about 3.9%; ATR of $4.55 implies a roughly ±$9 move over 4 days, and 4 days falls between the 2-3 day and 7-10 day guidance)
- Key Levels: Support at $518.90 (lower Bollinger Band; then SMA50D at $512.91), Resistance at $523.85 (EMA 13; then EMA 34 at $526.28)
OVERALL BIAS
OVERALL BIAS: BEARISH - Price is below the falling EMA 13/34, MACD is in a widening bearish crossover, −DI leads +DI, and RSI is below 50. The target is a drift toward the lower band and possibly SMA50D support. Neutral CMF and the intact long-term uptrend keep conviction modest.
This is educational analysis and not financial advice.