AAL 13-day bullish forecast — Nov 1, 2026
- Bias: Bullish
- Timeframe: 13 days (made Nov 1, 2026, target date Nov 13, 2026)
- Price at analysis: $12.61
- Price target: $12.80
- Expected range: $12.15 – $13.30
- Result: Correct (+4.5%) — closed at $13.17 on Nov 13, 2026; quality score 100/100
Get a free AI analysis of AAL today
Analysis
TECHNICAL INDICATORS
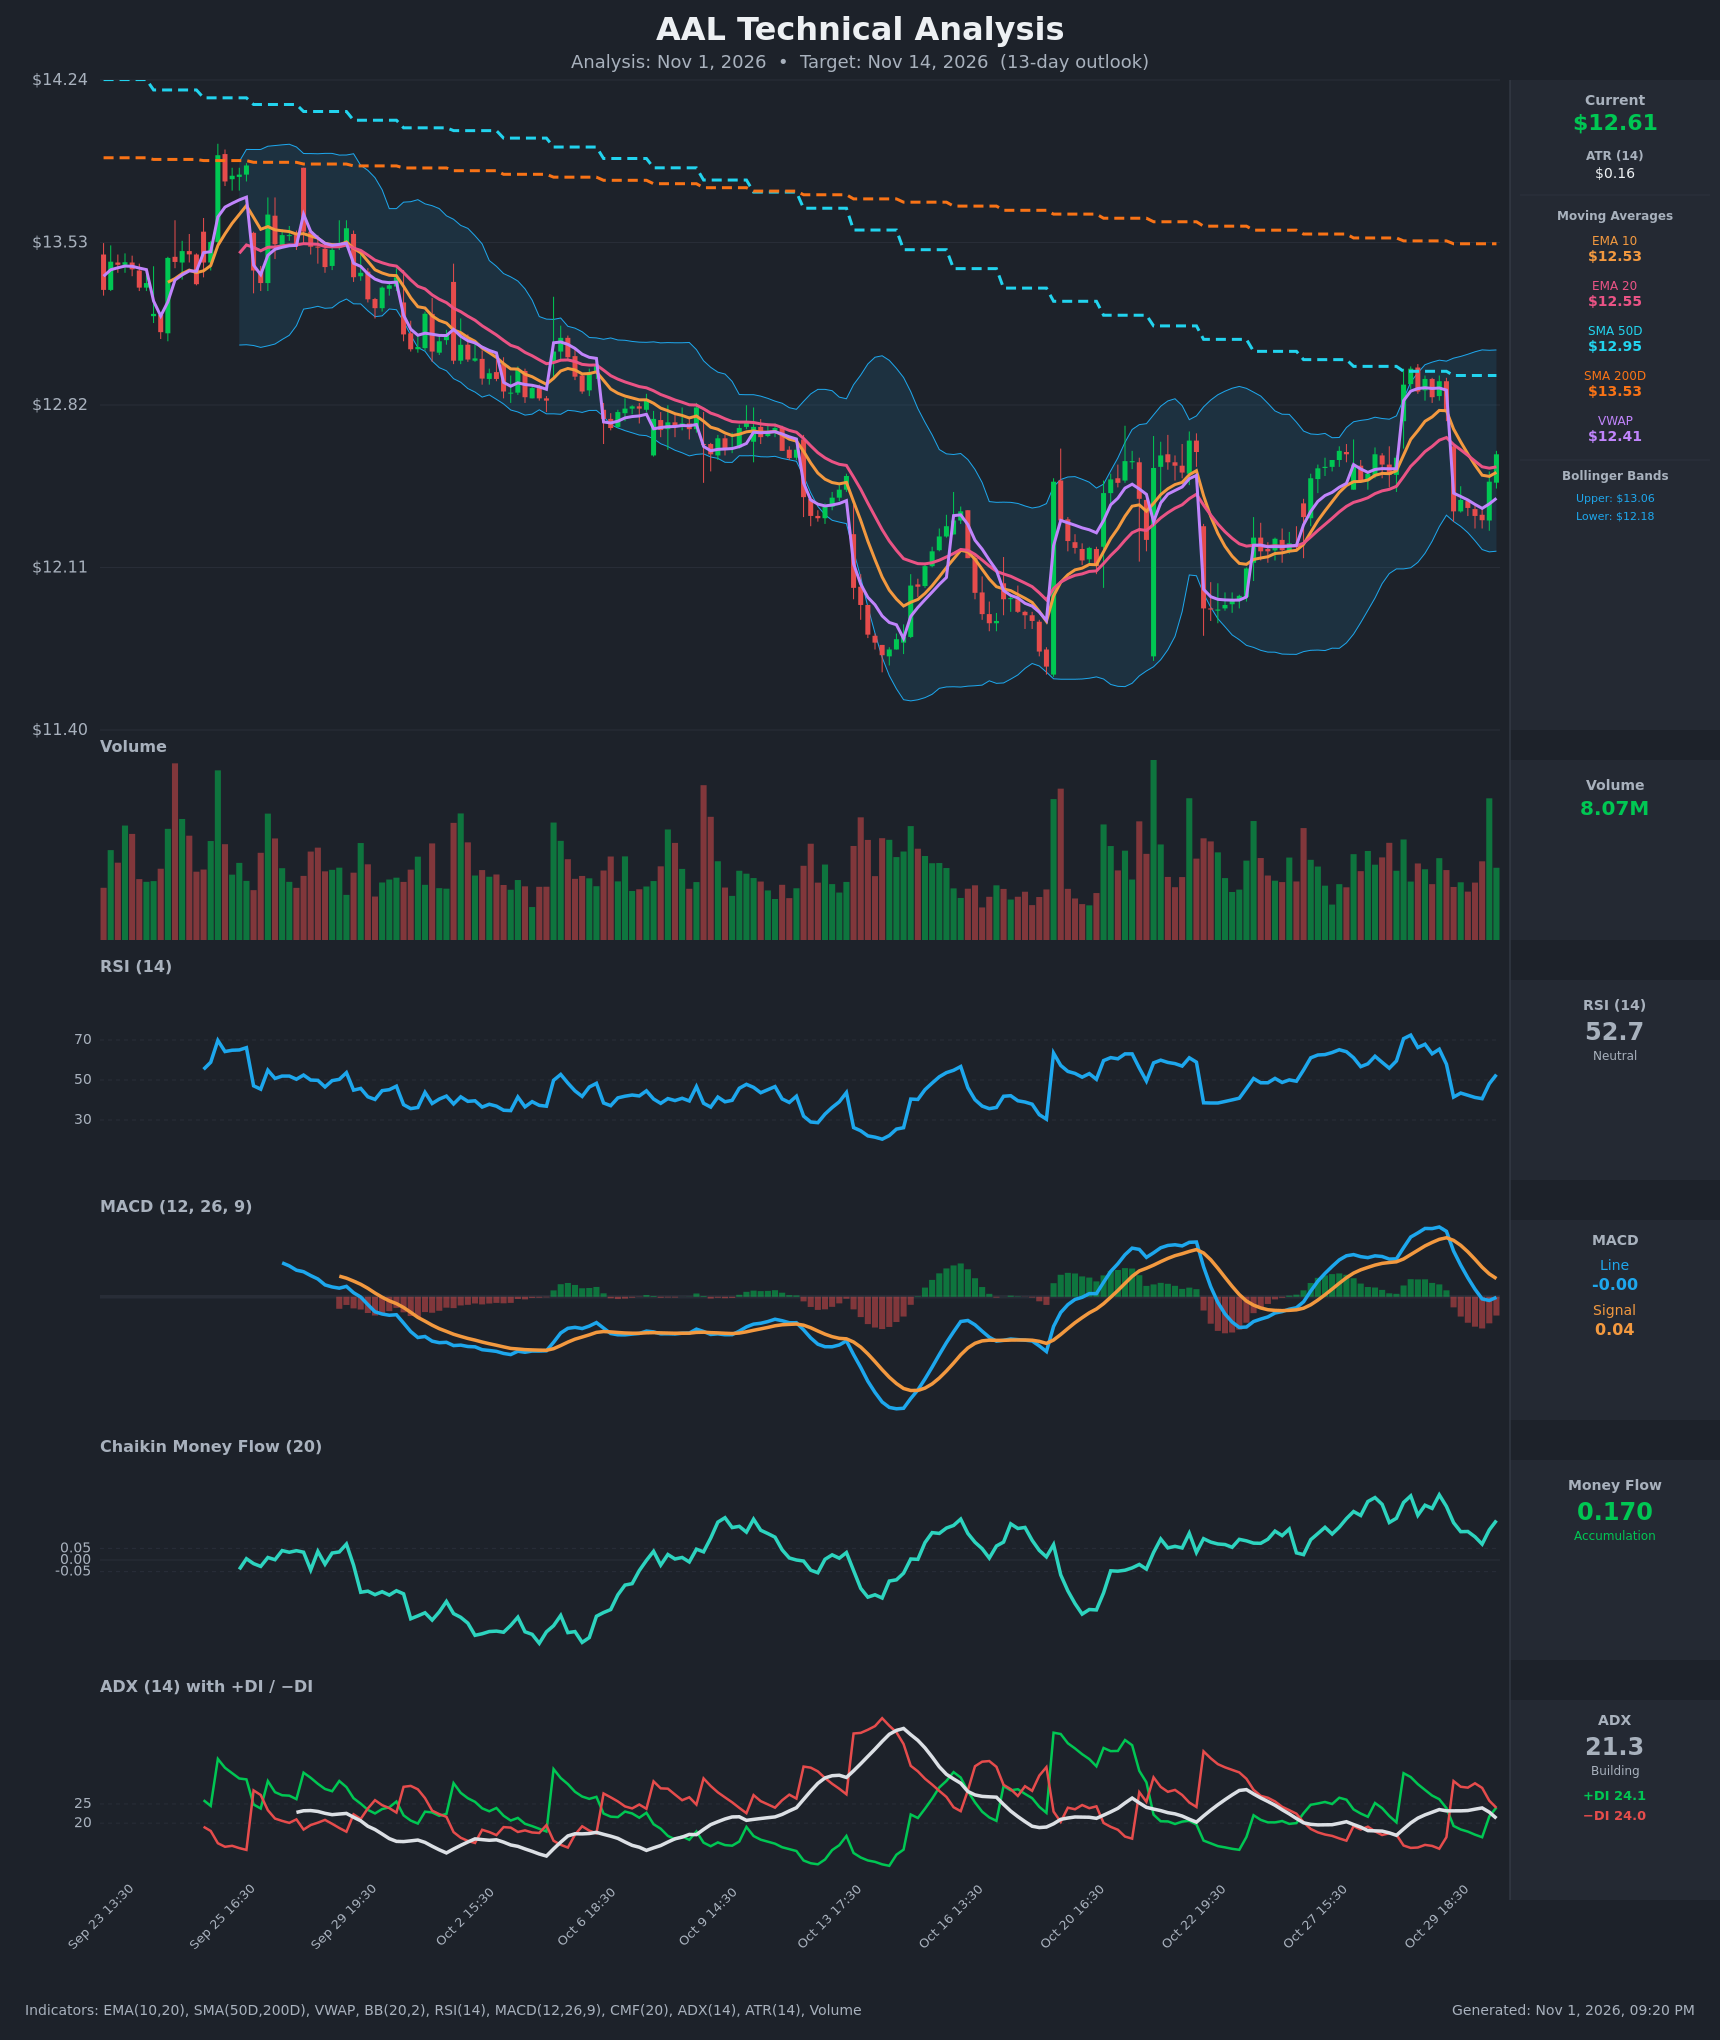
- RSI (14): 52.7, rebounding from about 40.7 on Oct 30 (17:30) and sitting at the neutral midline. Momentum is turning up but has no extreme reading. [Neutral]
- 20 EMA: $12.55, with price at $12.605 just above it. EMA10 ($12.526) is still slightly below EMA20, so the short-term cross is not yet bullish, but price reclaimed both after the Oct 30 drop. [Neutral]
- MACD: Line -0.0013 vs signal 0.0407, so the histogram is still negative at about -0.042. It has narrowed for three bars (-0.071, -0.059, -0.042) and the line is flattening near zero, which points to a possible bullish crossover soon. [Neutral]
- Bollinger Bands (20): Upper $13.06, lower $12.18, midline about $12.62. Price is pinned at the midline and the bands are moderately wide after the recent volatility. [Neutral]
- CMF (20): 0.170, well above +0.05 and sustained positive for weeks, a clear sign of accumulation. It has risen with price off the lows and shows no bearish divergence. [Accumulation]
- ADX (14): 21.3, with +DI 24.1 vs -DI 24.0. The trend is weak and the DI lines are essentially tied after +DI fell from 33 and -DI spiked to 31. +DI has just retaken the top, so there is no real trend yet. [Weak Trend, direction undecided]
- Volume: 8.07M on the latest bar, one of the larger recent bars, and it came on a green candle. That supports the bounce. [Mildly Bullish]
Other moving averages and VWAP:
- Price is above VWAP ($12.41), which is mildly bullish.
- Price is below SMA50 ($12.95) and SMA200 ($13.53), a long-term downtrend. SMA50 is below SMA200, so there is no golden cross and the death-cross structure persists.
DIVERGENCES & TRENDS
- There is no major divergence. CMF has made higher highs and stayed strongly positive while price has traded sideways to lower. That is mild bullish divergence, or accumulation under the surface.
- The MACD histogram is shrinking toward zero and RSI is turning up from 40, so downside momentum is fading.
- The Oct 29 to Oct 30 gap down reversed the earlier spike to $12.98 (RSI 72.5). The market has since recovered about half of that drop.
- The broader structure is a lower-high sequence from $13.5 to about $13.0, with a floor around $11.8–$12.0 on Oct 13–21. Higher lows since then argue that a base is forming.
- ADX and the DI lines are not showing a decisive trend, so the next move depends on a break of the $12.2–$13.0 range.
CHART PATTERNS
- The closest reference pattern is a Bullish Double Bottom / Triple-Bottom-style base around $11.8–$12.2. Price has since moved up and made a higher low near $12.3.
- A Bearish Rising Wedge is not valid here.
- The Oct 29 high near $13.0 was rejected at SMA50 ($12.95). That is the neckline-style resistance to clear.
- A move above $12.95–$13.05 would project toward the $13.5 SMA200 area.
- A break below $12.18 would invalidate the base and re-open $11.8.
POTENTIAL SCENARIOS
- Scenario 1: Bullish Base Breakout Attempt — CMF accumulation, a MACD histogram turning up and price above VWAP and EMA20 support a grind higher toward SMA50. Trigger: MACD bullish crossover and a hold above $12.55. Target: $12.95–$13.05, with a close around $12.80. Invalidation: close below $12.40. (45% probability)
- Scenario 2: Neutral Range Chop — Weak ADX and tied DI lines keep price between $12.2 and $12.95, as in the last two weeks. Trigger: repeated failures at both SMA50 and EMA20/VWAP. Target: $12.40–$12.85. Invalidation: a close outside $12.18–$13.05. (28% probability)
- Scenario 3: Bearish Rejection at Overhead Resistance — Price stays below the falling SMA50/200, and a failed bounce sends it back to the lower band. Trigger: a close below $12.40 (VWAP) with -DI retaking the lead. Target: $12.18, then $11.90. Invalidation: a close above $12.95. (27% probability)
PRICE TARGETS
Range width check: $13.30 – $12.15 = $1.15, which is 9.1% of $12.605. That fits the 8–12% guidance for a 13-day timeframe.
- Target Price: $12.80 (13 days)
- Expected Range: $12.15 to $13.30
- Key Levels: Support at $12.41 (VWAP), with deeper support at $12.18 (lower Bollinger Band). Resistance at $12.95 (SMA50).
OVERALL BIAS
OVERALL BIAS: BULLISH - Strong, sustained CMF accumulation, a narrowing MACD histogram, rising RSI and price holding above VWAP and EMA20 favor a modest push toward SMA50 at about $12.95. Conviction is limited because price remains below the declining SMA50 and SMA200 and ADX is weak.
This is educational analysis and not financial advice.