AMZN 13-day bearish forecast — Nov 1, 2026
- Bias: Bearish
- Timeframe: 13 days (made Nov 1, 2026, target date Nov 13, 2026)
- Price at analysis: $240.43
- Price target: $236.50
- Expected range: $228.50 – $252.00
- Result: Incorrect (+10.9%) — closed at $266.66 on Nov 13, 2026; quality score 0/100
Get a free AI analysis of AMZN today
Analysis
TECHNICAL INDICATORS
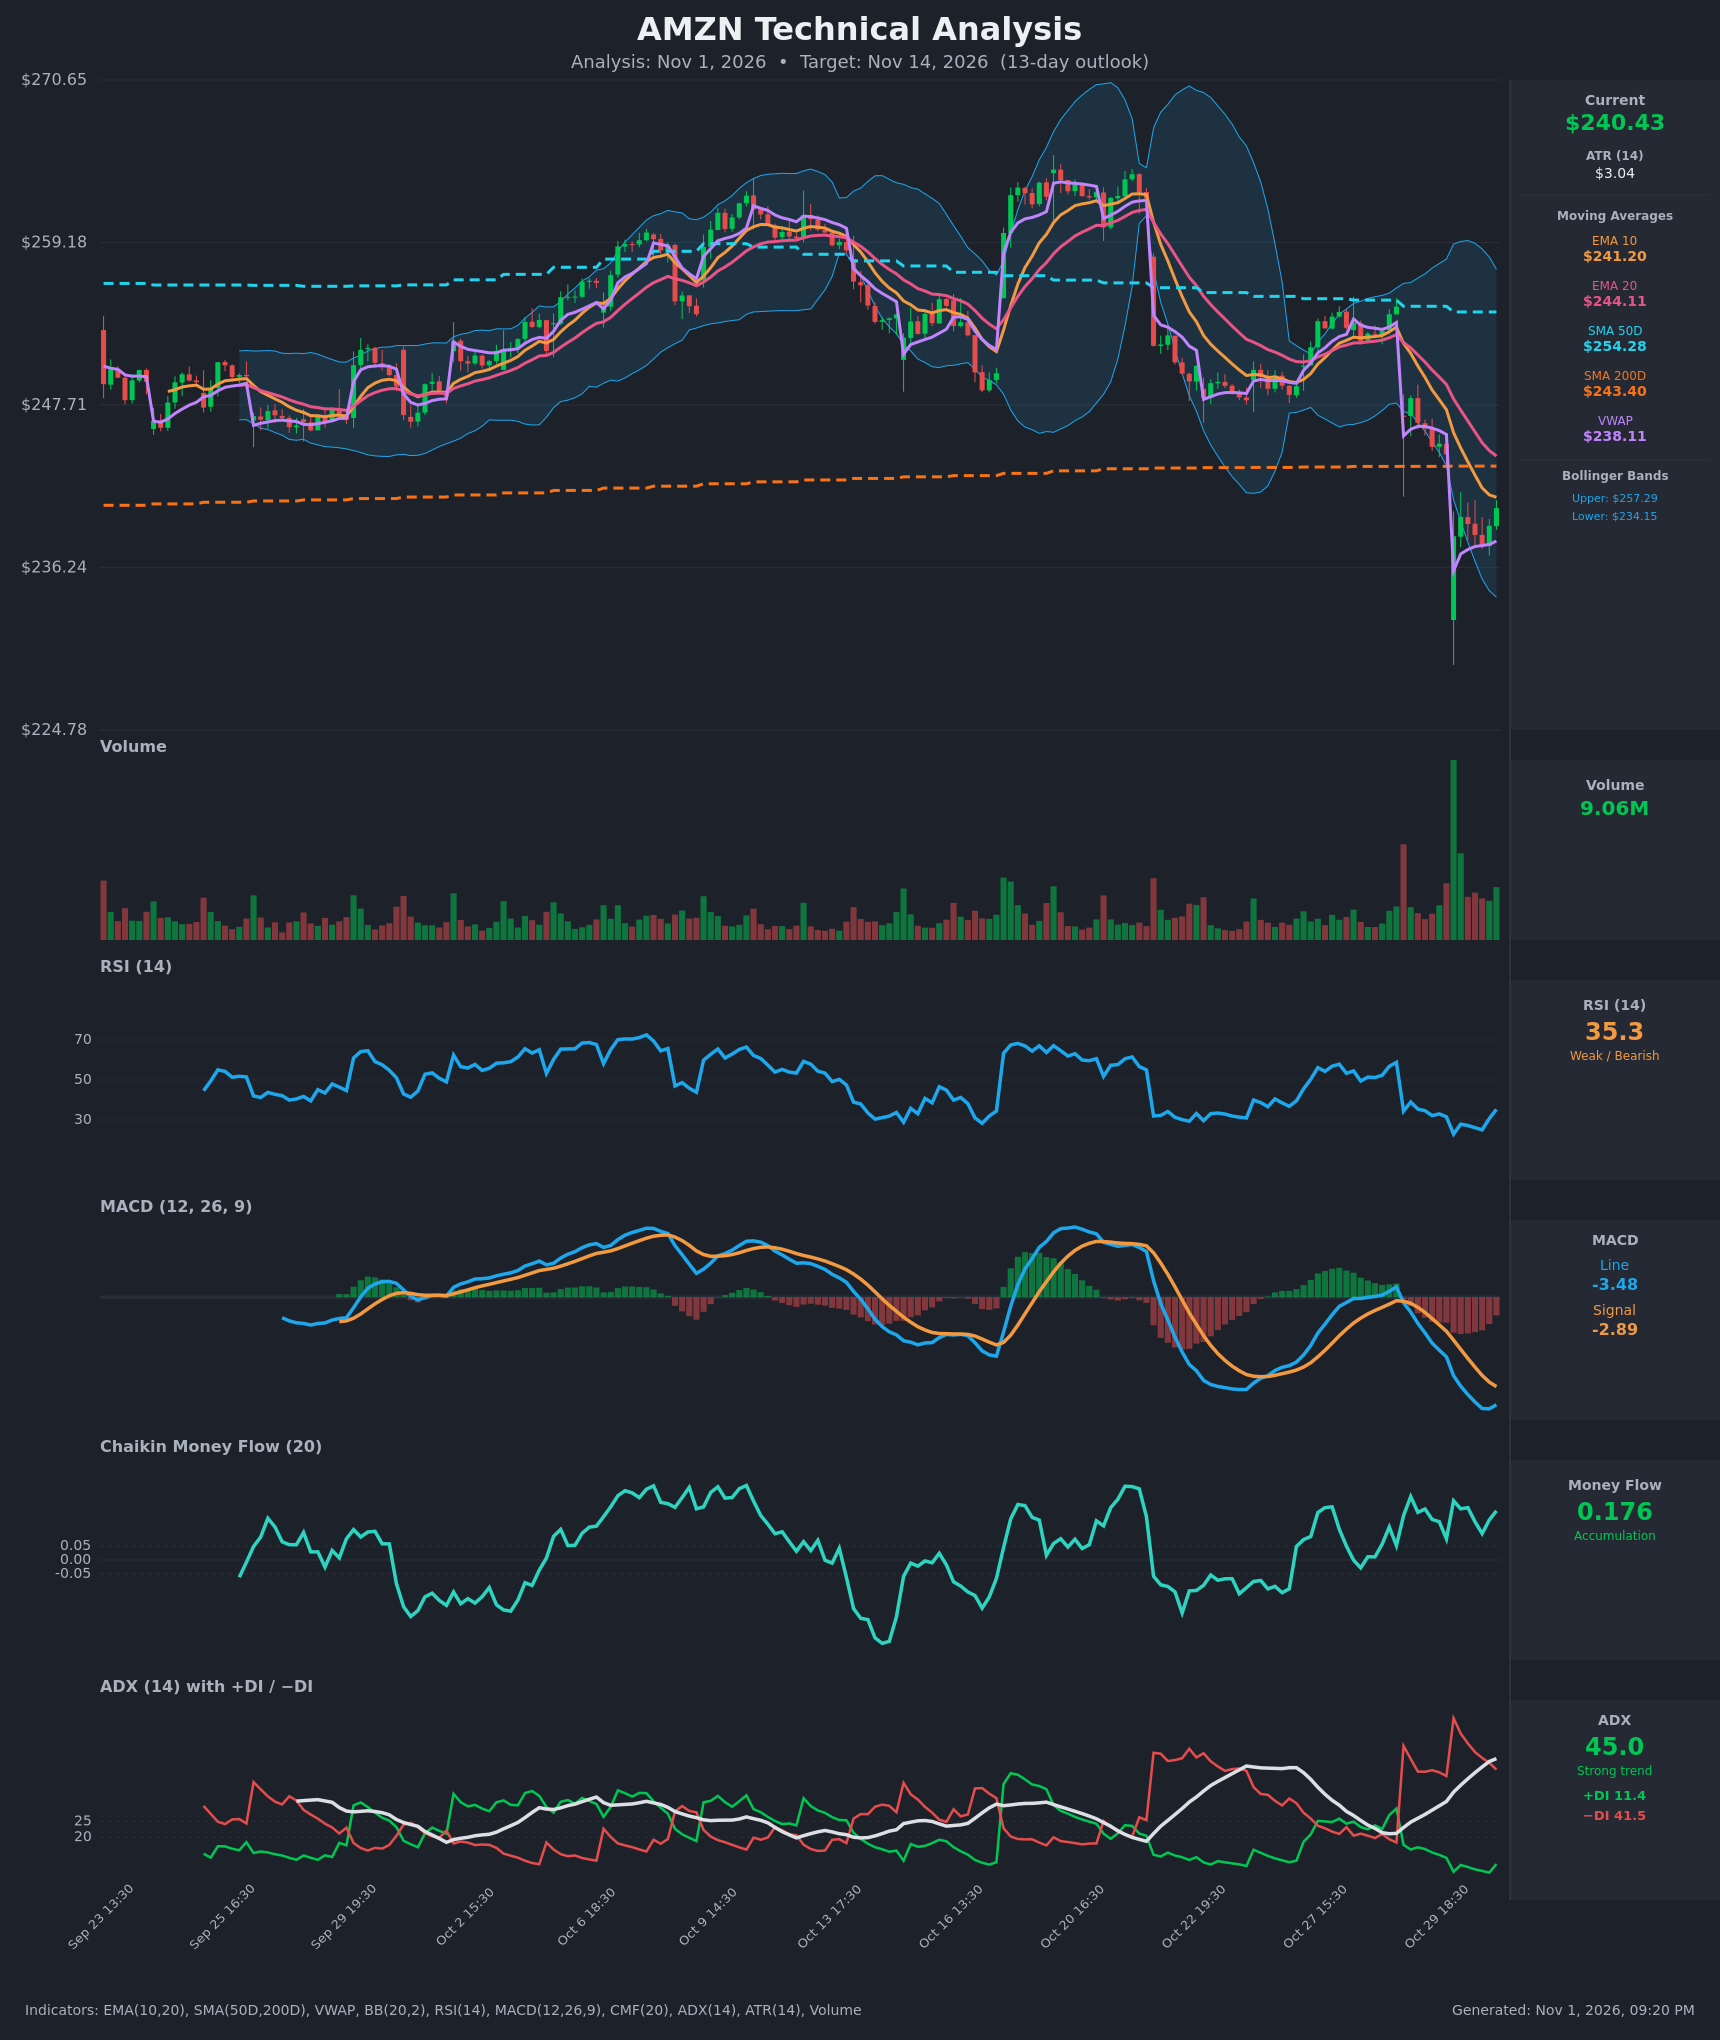
- RSI (14): 35.31, bouncing from a low of 22.9 (Oct 30 open) and 25.1 at the Oct 30 17:30 bar. It is still below 40 and under the 50 midline, so the bounce is a relief move inside a downtrend. Momentum direction is up short-term and weak overall. [Bearish]
- 20 EMA: $244.11, with price ($240.43) below it. The EMA10 ($241.20) is also above price and below the EMA20, a bearish stack that has been widening since Oct 29. Both slope down, so they act as resistance on any bounce. [Bearish]
- MACD: Line -3.48 vs Signal -2.89, with the line below the signal since Oct 29 and a negative histogram. The line ticked up slightly (-3.613 to -3.481) and the histogram is shrinking, an early hint of the downside momentum fading. No bullish crossover yet. [Bearish]
- Bollinger Bands (20): Upper $257.29, lower $234.15, midline about $245.7. Price is in the lower third of the bands, after a flush that pierced the lower band on the Oct 30 gap. The bands are wide after the volatility spike, so a relief bounce toward the midline is possible, but there is no squeeze or reversal signal. [Neutral]
- CMF (20): 0.176, sustained above +0.05 through the whole selloff. That implies buying into the weakness and closes in the upper part of the bar ranges. It conflicts with price and trend, and is the main bullish counterweight. [Accumulation]
- ADX (14): 45.0 and rising, with −DI at 41.5 well above +DI at 11.4. This is a very strong bearish trend, with bears firmly in control and no DI crossover. An ADX above 40 can also signal late-stage exhaustion. [Strong Trend – Bearish]
- Volume: 9.06M on the latest bar, with a huge volume spike on the Oct 30 gap-down bar. Volume has faded on the bounce, which suggests the relief move has little conviction. The gap-down spike marks a capitulation or event-driven reset. [Bearish – heavy-volume breakdown, fading bounce volume]
Other levels: price is below the SMA50 ($254.28) and just below the SMA200 ($243.40), a long-term support that has flipped to resistance. Price is above VWAP ($238.11), which is mildly constructive. The SMA50 is above the SMA200, so there is no death cross yet, but the gap between them is closing.
DIVERGENCES & TRENDS
- Bullish CMF divergence: CMF is positive (0.176) while price made a new swing low. This shows buyers absorbing supply, but it has not yet turned price.
- RSI/MACD: RSI made a sharp low (22.9) and is recovering, and the MACD histogram is contracting. Both are early signs of selling exhaustion, not confirmed reversals.
- Trend: ADX is climbing from 20 to 45 with −DI dominant, and the Oct 29-30 sequence shows consecutive lower highs and lower lows, with a gap below the 200-day SMA.
- Breaks: Price lost the EMA10, EMA20 and SMA200 on the Oct 29-30 drop. The earlier EMA10/EMA20 bearish cross is intact. There is no MACD bullish cross, and no DI cross.
- Gap overhead: The Oct 30 gap zone (about $246-$249) is likely to act as resistance.
CHART PATTERNS
- Bearish Flag / Pennant (continuation): After the sharp pole from about $254.65 to about $237.78, price is now making a small upward-drifting consolidation. A break below about $237.80 would confirm the pattern. The measured move (about $17) points to the low $220s, but over 13 days I treat only part of it as realistic.
- Lower highs from the Oct 22-27 peaks: The sequence of lower highs reinforces a bearish structure, similar to a descending channel.
- Possible Bullish Falling Wedge / bottoming attempt: The bounce from the lower Bollinger Band with positive CMF and a recovering RSI gives a counter-case. That would need a close above the EMA20 (about $244) and the SMA200 ($243.40) to validate.
POTENTIAL SCENARIOS
- Scenario 1: Bearish Flag Breakdown / Trend Continuation — The relief bounce stalls under the EMA10/EMA20 and the gap zone, then sellers push price back toward the lower Bollinger Band. ADX above 40 with −DI dominant favors trend continuation. Trigger: rejection at $241-$244 and a break below $237.80. Target: $234 to $229. Invalidation: daily close above $244.50 (EMA20 and SMA200 reclaimed). (50% probability)
- Scenario 2: Bullish Relief Rally / Mean Reversion — Positive CMF and a rebound from oversold RSI fuel a squeeze back to the Bollinger midline and the gap fill. Trigger: close above $244.11 with a MACD histogram turn. Target: $247 to $250. Invalidation: loss of $234. (33% probability)
- Scenario 3: Neutral Base Building — Price chops between the lower band and the EMA20 as the volatility spike digests. Trigger: failure to break either $234 or $244 decisively. Target: $236 to $243. Invalidation: close outside that range. (17% probability)
PRICE TARGETS
- Target Price: $236.50 (13-day horizon, Nov 14, 2026)
- Expected Range: $228.50 to $252.00 (width $23.50, about 9.8% of current price, in line with the 8-12% guidance for 14-21 days, scaled slightly narrower for 13 days)
- Key Levels: Support at $234.15 (lower Bollinger Band), Resistance at $244.11 (EMA20, with the SMA200 at $243.40 just below it)
OVERALL BIAS
OVERALL BIAS: BEARISH - ADX at 45 with −DI far above +DI, price below the EMA10/EMA20/SMA200, a negative MACD below its signal, and a post-gap bear-flag structure outweigh the positive CMF and the oversold bounce. Conviction is modest, since CMF accumulation and a recovering RSI could still produce a relief rally toward $244-$248.
This is educational analysis and not financial advice.