SOXS 13-day bearish forecast — Nov 1, 2026
- Bias: Bearish
- Timeframe: 13 days (made Nov 1, 2026, target date Nov 13, 2026)
- Price at analysis: $52.05
- Price target: $49.90
- Expected range: $47.60 – $53.40
- Result: Correct (-2.4%) — closed at $50.78 on Nov 13, 2026; quality score 100/100
Get a free AI analysis of SOXS today
Analysis
TECHNICAL INDICATORS
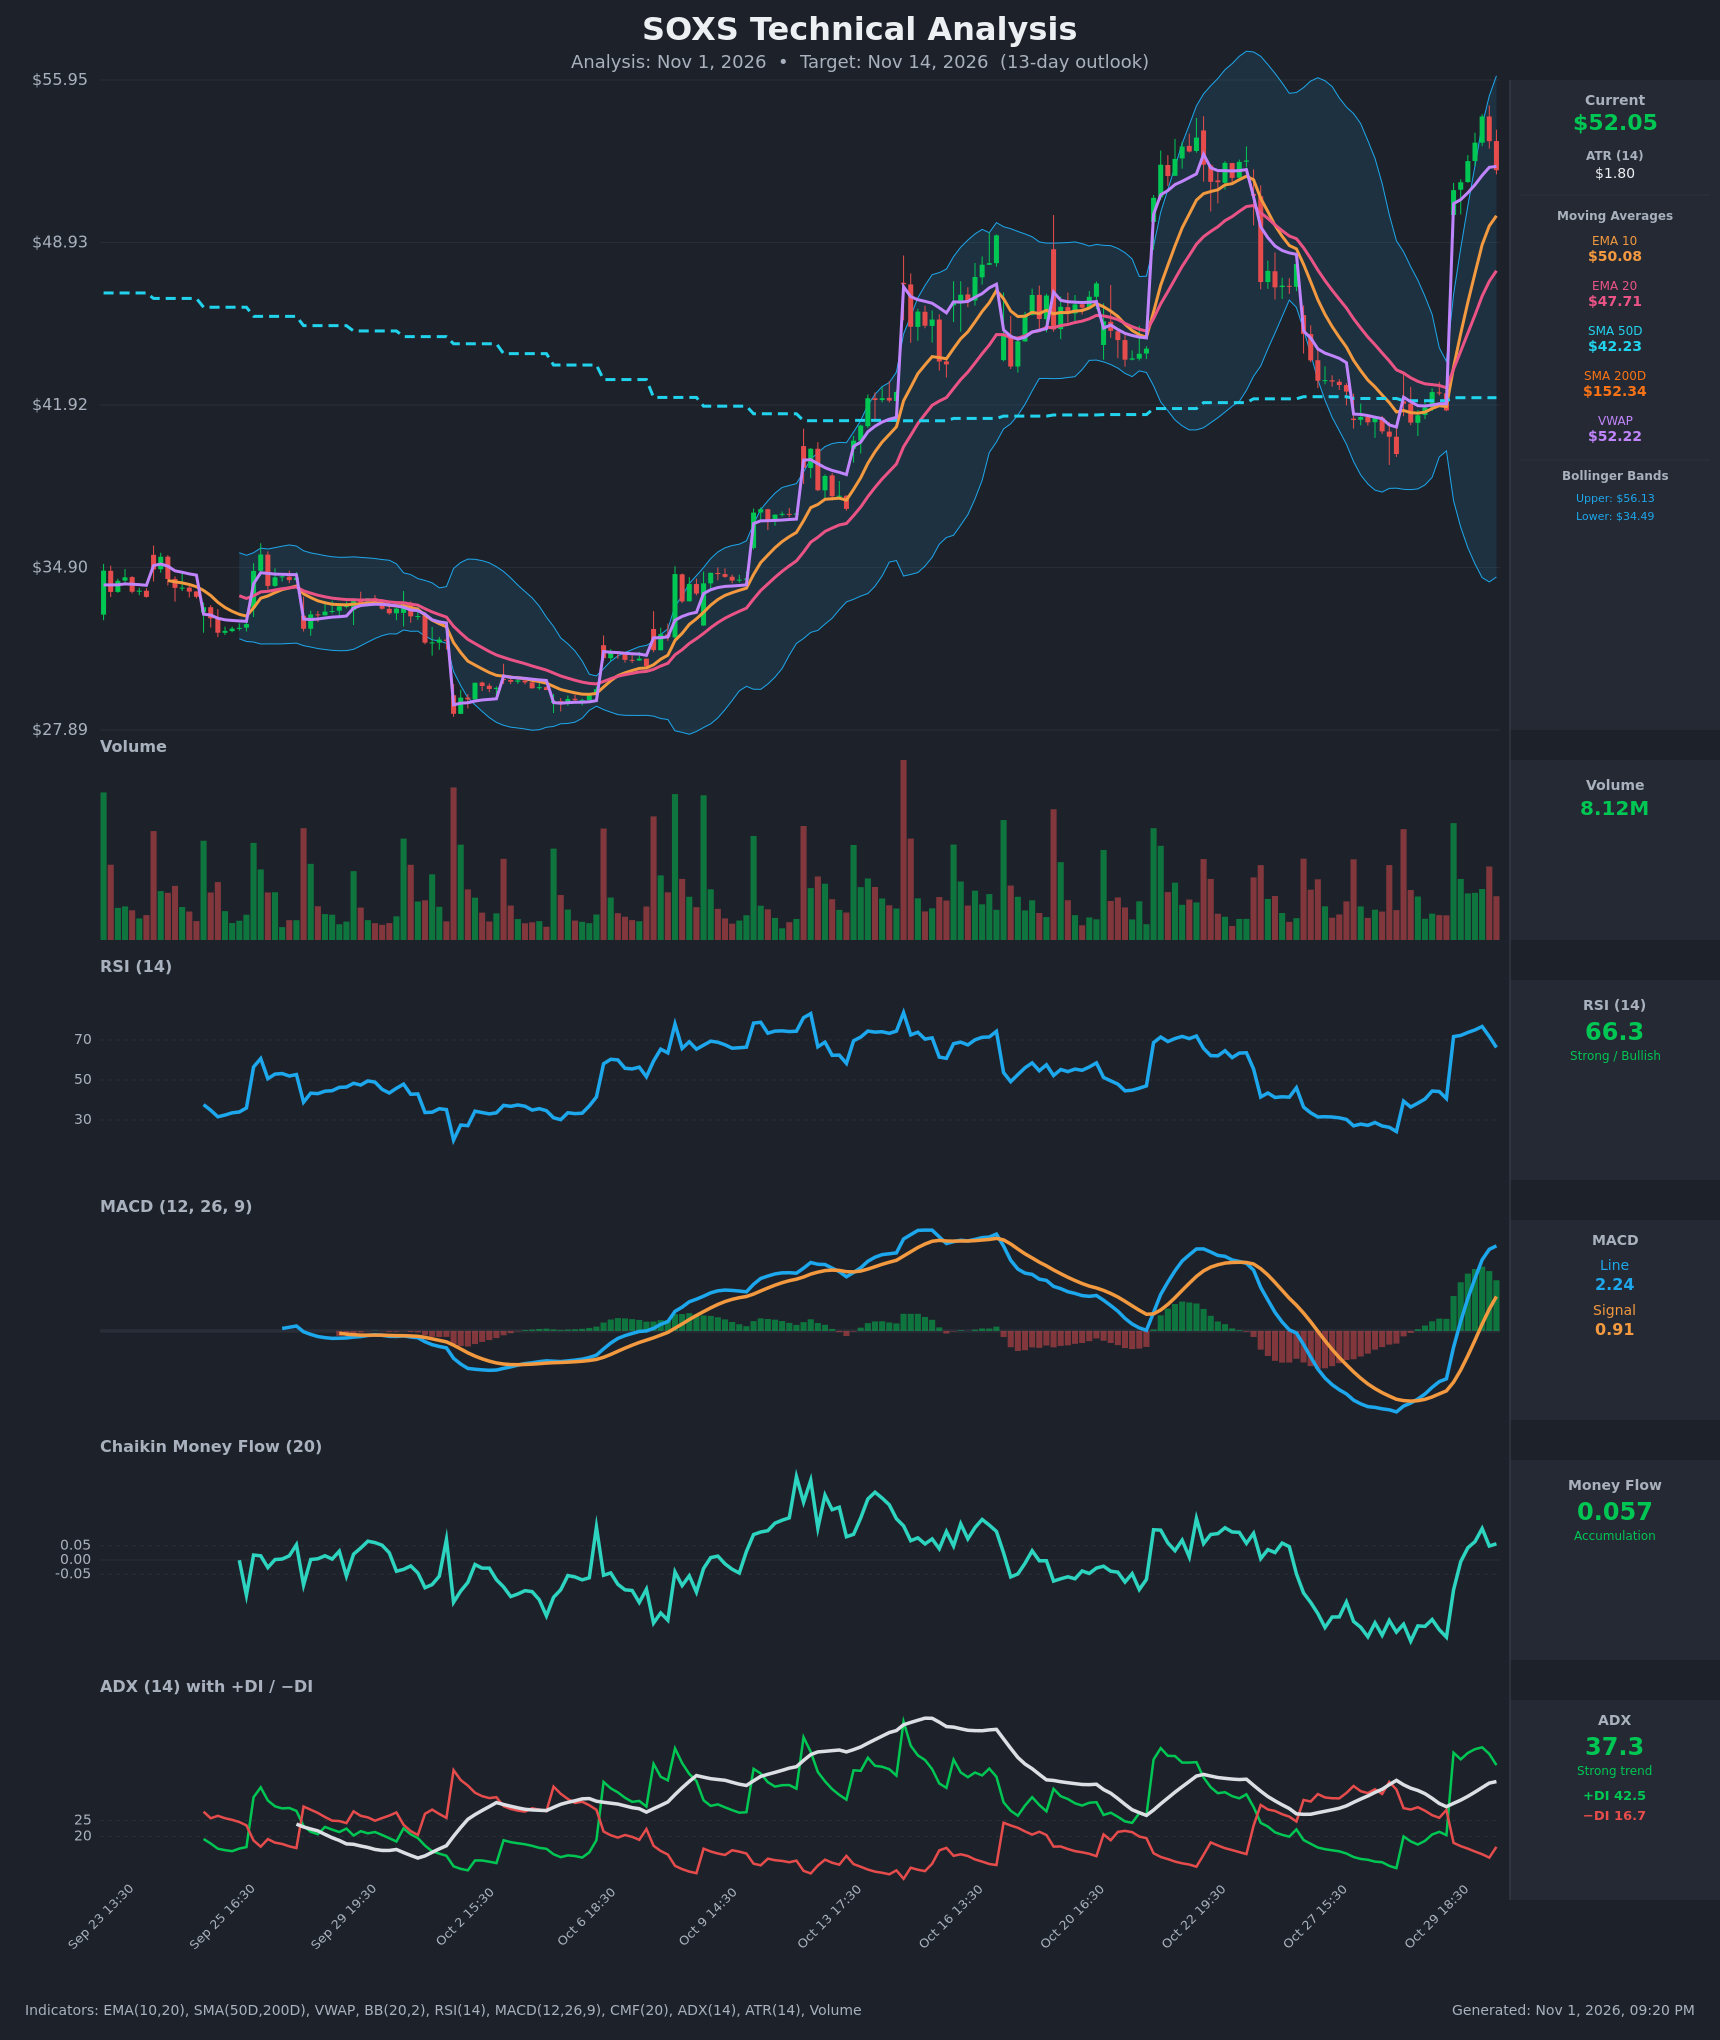
- RSI (14): 66.27, down from a peak of 76.8 on the Oct 30 17:30 bar. It was overbought and is now rolling over, which shows momentum fading after the gap-up. [Neutral]
- 20 EMA: $47.71, with EMA10 at $50.08 above it. Price at $52.05 is above both, so they act as dynamic support. EMA10 is about 3.8% below price and EMA20 about 8.3% below, so price is stretched above the averages. [Bullish]
- MACD: Line 2.24 is above Signal 0.91, with a positive and expanding histogram. The bullish cross happened around Oct 30 14:30. The line is still rising, but its pace is slowing as price pulls back. [Bullish]
- Bollinger Bands (20): Upper $56.13, lower $34.49, so the bands are very wide after the volatility spike. Price is in the upper half, about 4 points below the upper band, after being rejected near $54.4. A pullback toward the midline (about $45.3) is plausible. [Neutral]
- CMF (20): 0.057 is just above the +0.05 threshold. It recovered from deeply negative readings but peaked around 0.11 and is fading, so accumulation is marginal. [Accumulation]
- ADX (14): 37.3 and rising, with +DI at 42.5 and −DI at 16.7. Bulls are clearly in control of a strong trend, although +DI has slipped from 48 and the trend is already extended. [Strong Trend, Bullish]
- Volume: 8.12M, moderate. The gap-up bar carried the heaviest volume, and volume has tapered on the follow-through, with the last two candles red. This suggests the push higher is losing participation. [Fading participation]
DIVERGENCES & TRENDS
- RSI divergence: Price made a high of $54.37 and RSI peaked at 76.8. RSI has since fallen to 66.3 faster than price, an early sign of short-term exhaustion rather than a full divergence.
- MACD: The bullish cross is fresh and the histogram is still expanding, so there is no bearish cross yet. The MACD line sits well above zero after a sharp V-shaped reversal.
- VWAP: Price ($52.05) is essentially at VWAP ($52.22), a neutral to slightly weak reading after trading above it.
- EMA structure: EMA10 has crossed above EMA20, a bullish crossover that is still widening.
- SMA200D ($152.34): The distance from price is extreme, and the SMA200D falling from $156 to $152 suggests a split-adjustment artifact. I give it no weight. SMA50D at $42.23 is far below price, and price is above it.
- ADX/DI: The −DI crossed below +DI on Oct 30 and the gap is wide. ADX is rising, which confirms trend strength, but readings above 35 often precede consolidation.
- Price action: The move was a roughly 23% gap from $41.69 to $51.19 and a push to $54.37. The last two bars made a lower high and a lower close, which is the first sign of a pullback.
CHART PATTERNS
- Gap and sharp V-reversal: This is a V-bottom rally with no base. It is not a classic pattern from the diagram, but it is prone to retracement.
- Possible Bearish Double Top or Rising Wedge (early): Tops near $54.4 and $53 on an hourly basis could be forming. This is unconfirmed, and a break below about $50 would activate it with a measured target around the $47 to $48 EMA20 zone.
- Bullish Flag or Pennant (alternate): If price holds $50 to $52 in a tight pullback and then breaks above $54.4, the flag measured move targets $56 to $58.
- Neither pattern is confirmed. The tilt is toward a pullback because of the lack of consolidation, the fading RSI, and the leveraged-ETF mean reversion tendency.
POTENTIAL SCENARIOS
- Scenario 1: Bearish Pullback to the EMAs — After the vertical rally, RSI is rolling over, volume is fading, and the last two candles are red. Price retraces toward the EMA10/EMA20 zone, with the gap area as a deeper pullback target. Trigger: a break below $50.08 (EMA10) on increasing volume. Target: $47.70 to $49.90. Invalidation: a close above $54.40. (47% probability)
- Scenario 2: Bullish Trend Continuation — ADX is 37 with +DI dominant and MACD expanding. A shallow pullback holds EMA10 and the trend resumes toward the upper Bollinger Band. Trigger: a hold above $50 and a break above $54.37. Target: $56.10 to $58. Invalidation: a close below $47.70 (EMA20). (38% probability)
- Scenario 3: Neutral Consolidation — Price digests the gap between $49 and $54 as ADX flattens. Trigger: repeated closes inside $50 to $54. Target: $51 to $53. Invalidation: a close outside $49 to $54.4. (15% probability)
PRICE TARGETS
- Target Price: $49.90 (13-day)
- Expected Range: $47.60 to $53.40 (width $5.80, about 11.1% of the current price, in line with the 13-day guidance)
- Key Levels: Support at $50.08 (EMA10, with $47.71 EMA20 below), Resistance at $54.37 (recent high)
OVERALL BIAS
OVERALL BIAS: BEARISH - After a 23% vertical gap, RSI is rolling over from overbought, volume and CMF are fading, and the last two candles made a lower high and close. A pullback toward the EMA10/EMA20 zone is more likely than a clean continuation, although ADX and MACD remain bullish, which keeps conviction modest.
This is educational analysis and not financial advice.