AAPL 13-day bearish forecast — Nov 1, 2026
- Bias: Bearish
- Timeframe: 13 days (made Nov 1, 2026, target date Nov 13, 2026)
- Price at analysis: $344.79
- Price target: $340.50
- Expected range: $329.50 – $358.00
- Result: Incorrect (+3.1%) — closed at $355.32 on Nov 13, 2026; quality score 47/100
Get a free AI analysis of AAPL today
Analysis
TECHNICAL INDICATORS
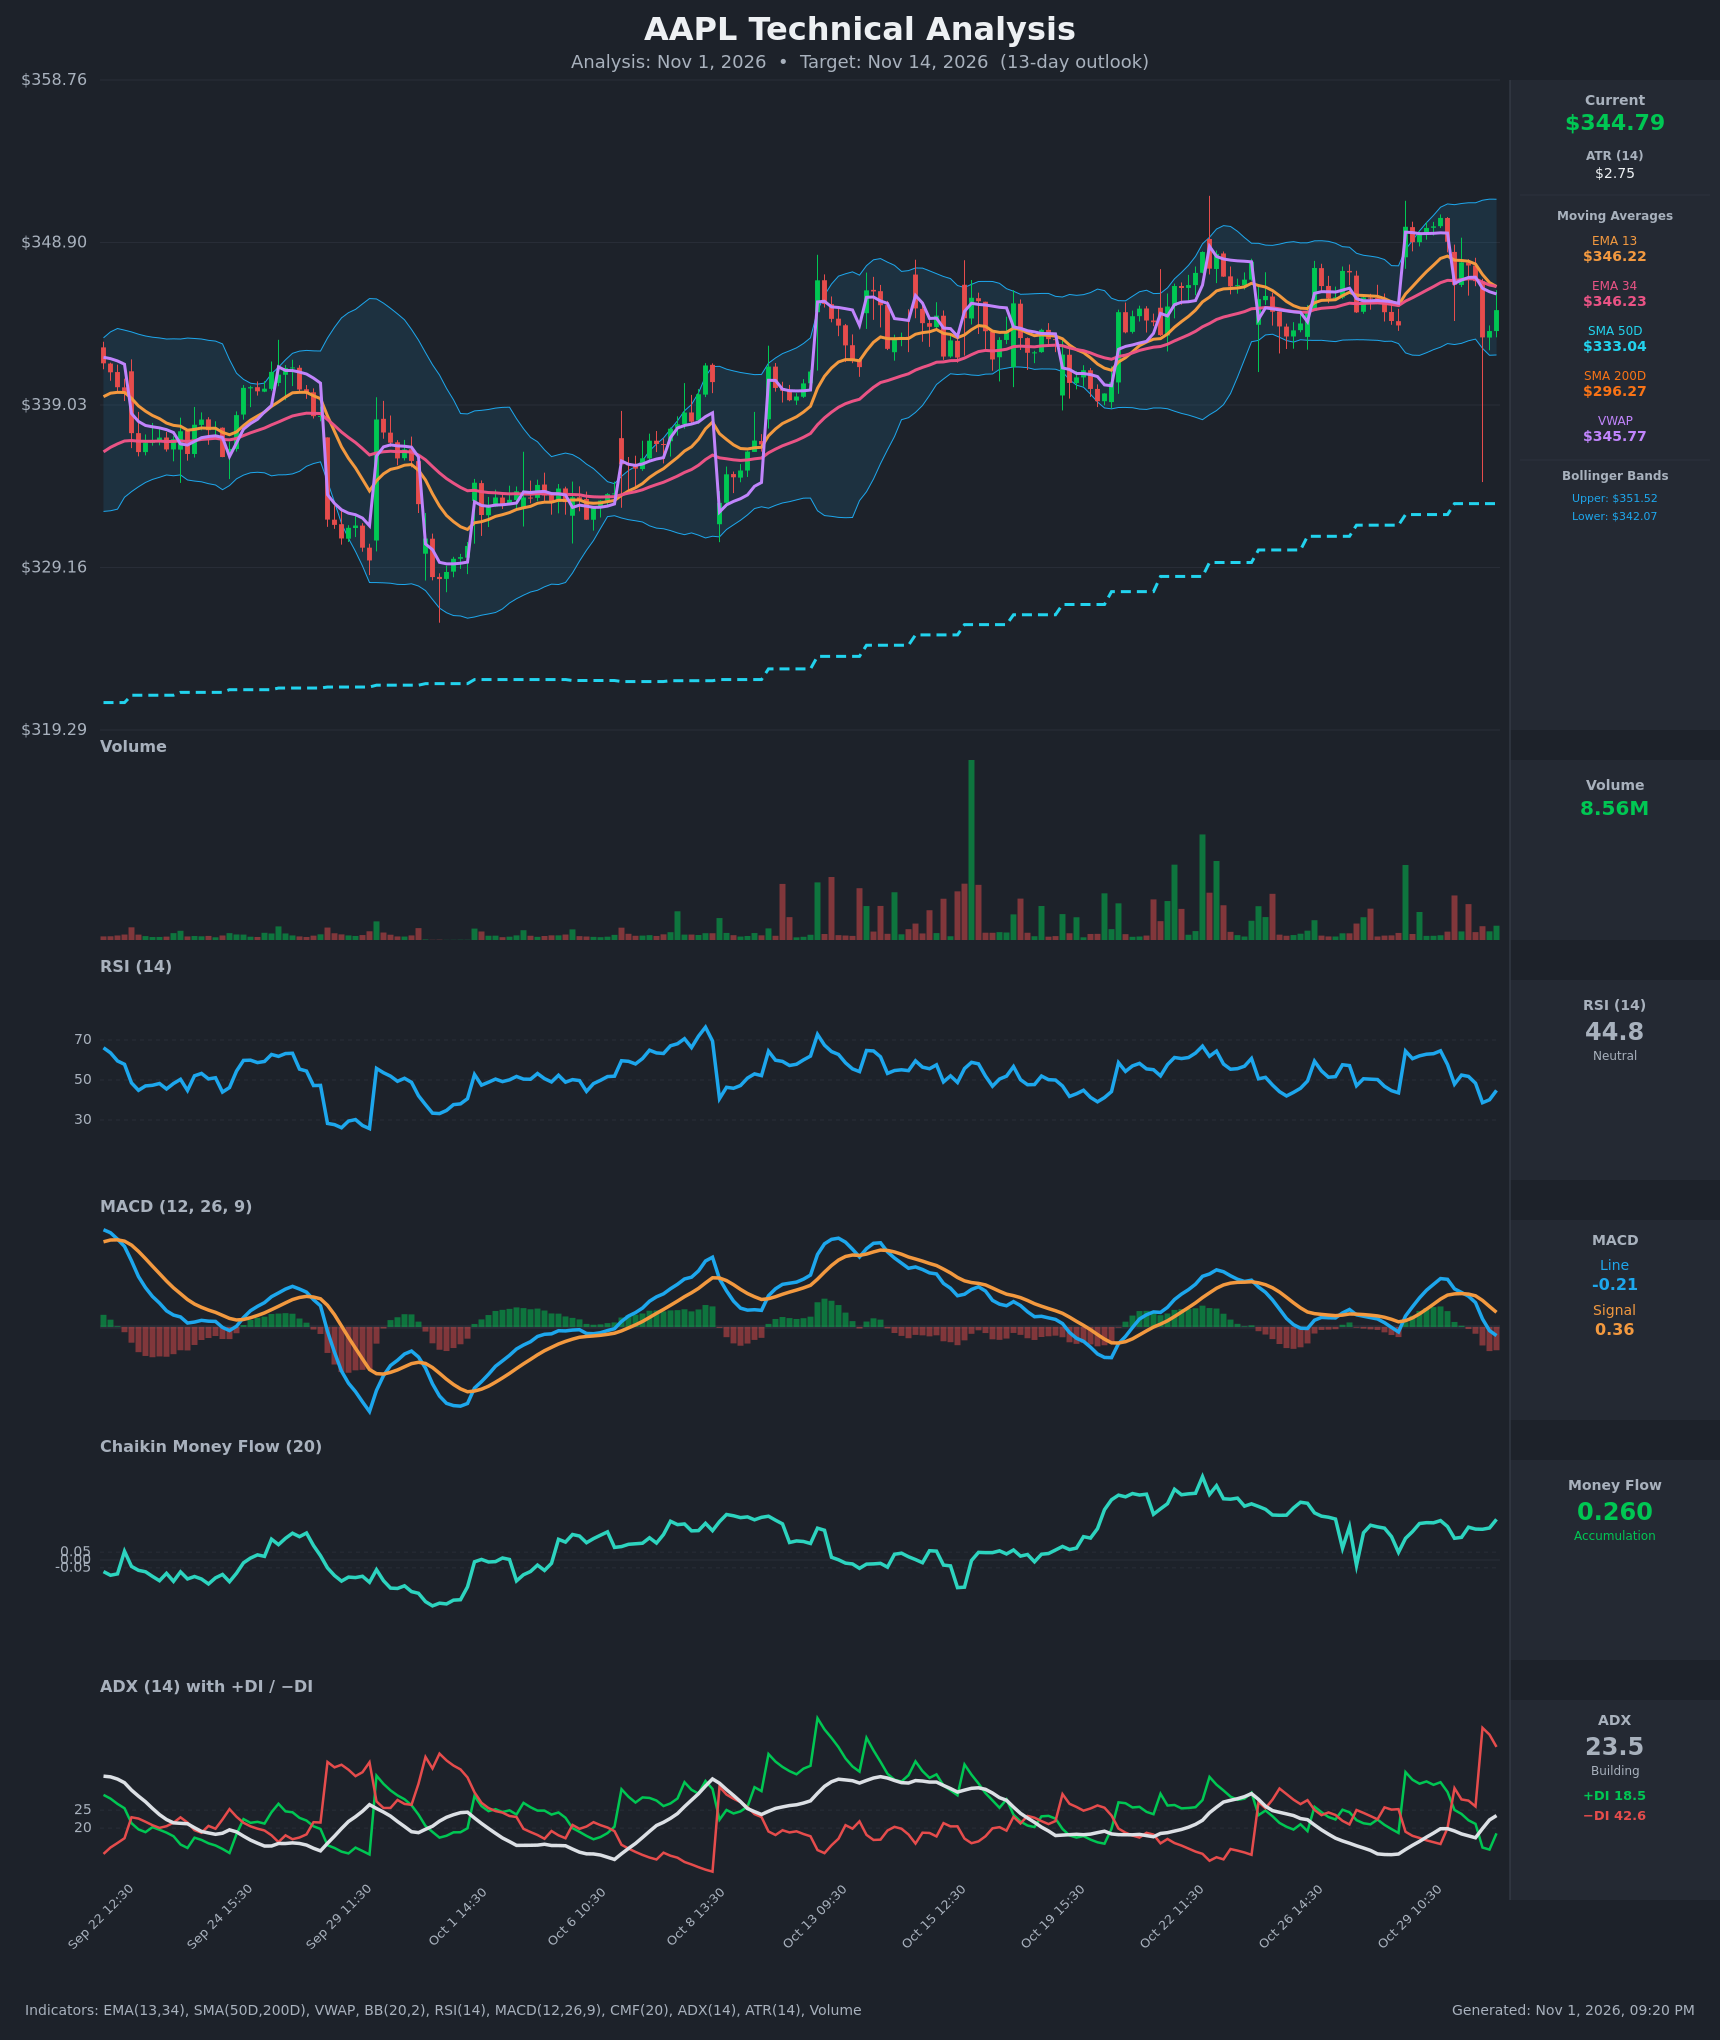
- RSI (14): 44.80, slipping from the low 60s on Oct 29 to just under 40 on Oct 30 before a small bounce. It sits below 50 but well above oversold, so momentum is soft with no extreme. [Bearish]
- 20 EMA: The supplied EMAs are EMA 13 at $346.22 and EMA 34 at $346.23. Price at $344.79 is below both, and EMA 13 has just rolled below EMA 34 (a flat, marginal bearish cross). The pair now acts as overhead resistance around $346.2. [Bearish]
- MACD: Line -0.21 against signal 0.36, a fresh bearish crossover on Oct 30 (the line was +1.19 on Oct 29). The histogram has turned negative and is expanding downward. [Bearish]
- Bollinger Bands (20): Upper $351.52, lower $342.07, midline about $346.8. Price is in the lower half of the bands, about $2.7 above the lower band. The bands are fairly narrow and flat, which fits a range. A wick pierced the band on the Oct 30 flush and price recovered. [Neutral]
- CMF (20): +0.260, well above +0.05 and positive for weeks. Buying pressure has held through the pullback, which is the main bullish counterweight. [Accumulation]
- ADX (14): 23.5 and rising (up from 12.8 on Oct 28), with −DI at 42.6 well above +DI at 18.5. Trend strength is building, and the bears currently control direction. [Building Trend – Bearish]
- Volume: 8.56M, about average, with no capitulation spike on the Oct 30 drop. The largest volume bars on the chart came on up moves (mid-Oct and Oct 29), so there has been no heavy distribution. Price is also below VWAP ($345.77). [Neutral/Slightly Bearish]
DIVERGENCES & TRENDS
- Short-term bearish shift: On Oct 30, MACD crossed below its signal line. EMA 13 crossed below EMA 34, and −DI jumped from about 26 to 48 on the 13:30 selloff, while +DI collapsed to 14.6.
- Mild divergence: CMF remains strong at +0.26 while price, RSI and MACD roll over. Money flow is bullish while momentum is bearish, which suggests a pullback inside an uptrend rather than a trend break.
- Higher-timeframe trend: Price is above SMA 50 ($333.04) and SMA 200 ($296.27). SMA 50 is far above SMA 200, so the golden-cross structure is intact. The long-term trend is up, and both averages are rising.
- Rejection near $350: Price was rejected at $350.39 on Oct 29 and failed to hold above $349. It has since fallen back through VWAP and both EMAs.
- ADX caution: The ADX rise is driven mostly by one sharp selloff bar. It needs follow-through to confirm.
CHART PATTERNS
- Rectangle / range (Bearish Double Top flavor): Since mid-October, price has oscillated between roughly $340 and $350. The failure at $349–350 twice (around Oct 22 and Oct 29) resembles a Bearish Double Top with its neckline near $342–343, the lower Bollinger Band and recent swing lows. A close below $342 would project a measured move of about $7–8 (the $350 to $342 height), giving a target near $334–335.
- Not a reversal of the major trend: The SMA 50 and SMA 200 stack remains bullish. If the range holds, this is just a consolidation that resolves up, as in a bullish continuation structure.
- Significance: The pattern is unconfirmed until $342 breaks. The flush wick toward the mid-$330s on Oct 30 shows dip buyers are active.
POTENTIAL SCENARIOS
- Scenario 1: Bearish Range-Low Breakdown / Retest — Bearish momentum (MACD cross, −DI dominance, EMA 13/34 flip) pushes price below the lower Bollinger Band and the Double Top neckline. Price then drifts toward the $338–340 zone, with a possible extension to $334–335. Trigger: Hourly close below $342.00. Target: $338.00–$340.00, extending to $334.50. Invalidation: Hourly close back above $346.25 (EMA cluster), then $348. (45% probability)
- Scenario 2: Neutral Range Persistence — Price chops between $341 and $349, with CMF accumulation absorbing selling and the bands staying flat. Trigger: Price holds $341–342 and fails to close above $349. Target: $343–$347. Invalidation: Close outside $340–$350. (25% probability)
- Scenario 3: Bullish Dip-Buy Recovery — CMF strength and the rising SMA 50 attract buyers. Price reclaims the EMA cluster and VWAP and retests the range highs. Trigger: Close above $346.25 with MACD re-crossing up. Target: $349–$351.50, with an upside extension to $354. Invalidation: Loss of $342. (30% probability)
PRICE TARGETS
- Target Price: $340.50 (13-day horizon)
- Expected Range: $329.50 to $358.00 (width $28.50, about 8.3% of the current price, in line with the 14–21 day guidance and much wider than a 2–3 day range)
- Key Levels: Support at $342.07 (lower Bollinger Band, then $340.00 and the SMA 50 near $333), Resistance at $346.25 (EMA 13/34 cluster, then $350.00)
OVERALL BIAS
OVERALL BIAS: BEARISH - MACD has crossed bearishly, −DI dominates +DI with ADX rising, and price is below the EMAs and VWAP after being rejected near $350. Strong CMF and the SMA 50/200 support keep the bias modest, so the likely path is a drift toward $338–341.
This is educational analysis and not financial advice.