XLF 13-day bullish forecast — Nov 1, 2026
- Bias: Bullish
- Timeframe: 13 days (made Nov 1, 2026, target date Nov 13, 2026)
- Price at analysis: $56.53
- Price target: $57.05
- Expected range: $54.40 – $58.50
- Result: Correct (+3.8%) — closed at $58.68 on Nov 13, 2026; quality score 98/100
Get a free AI analysis of XLF today
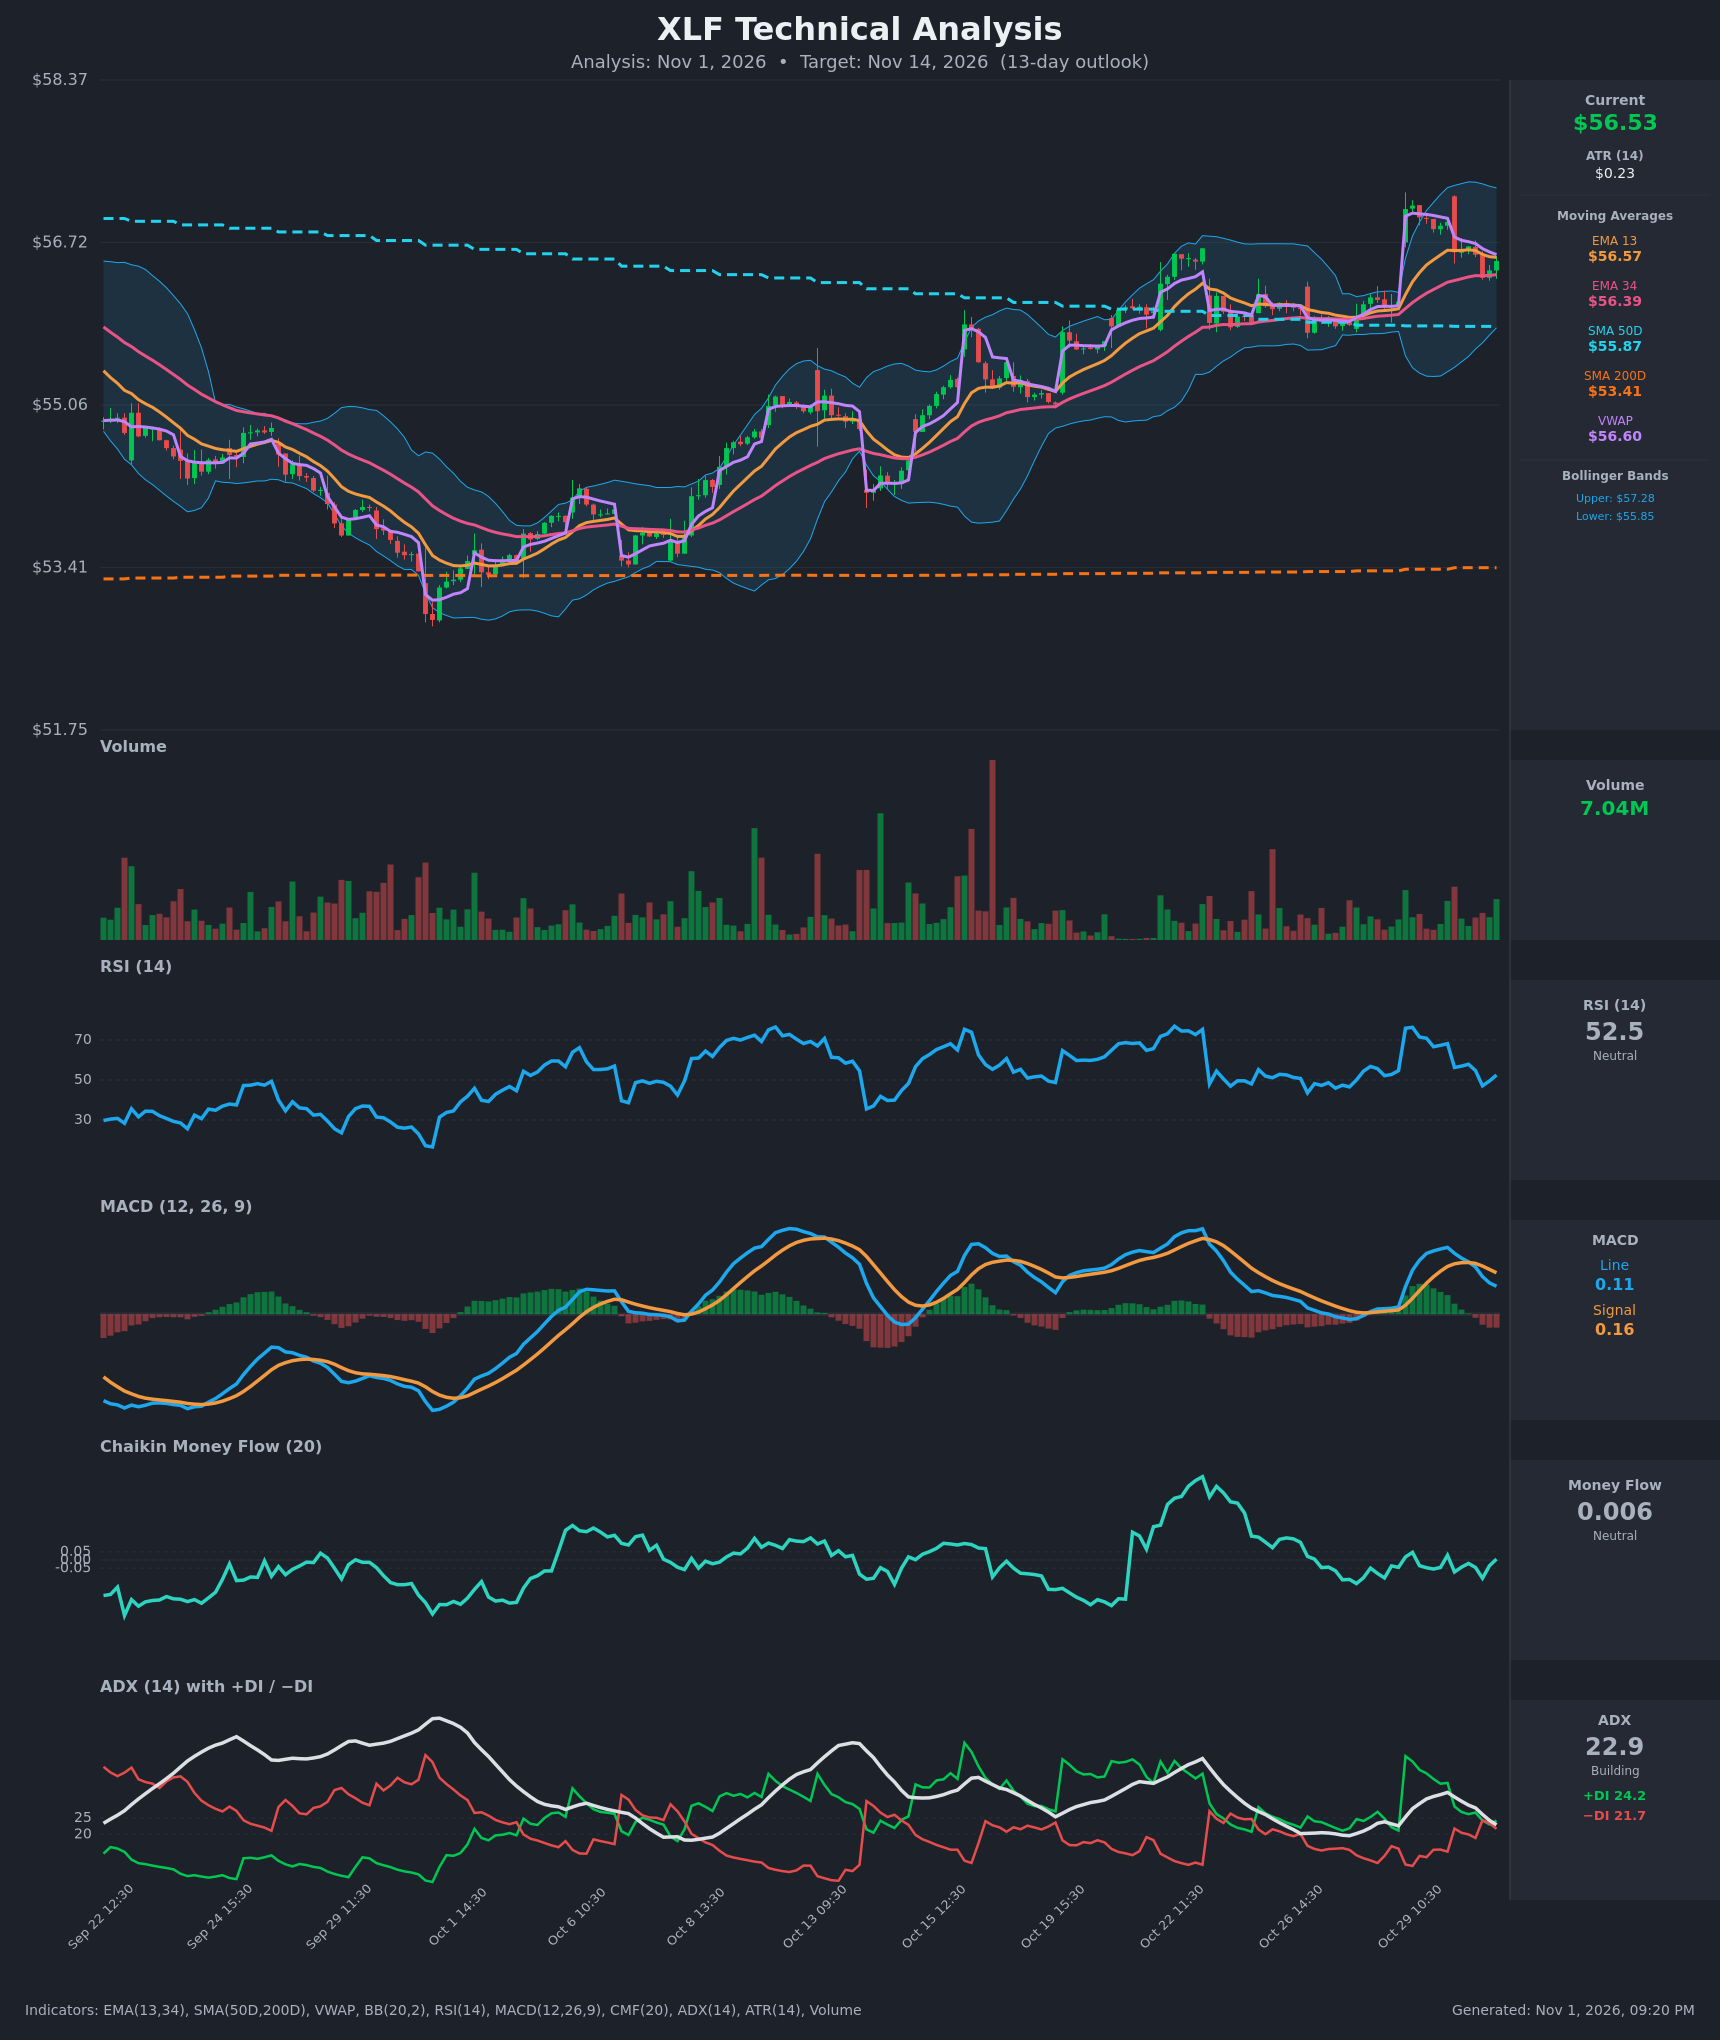
Analysis
TECHNICAL INDICATORS
- RSI (14): 52.48, mid-range and neutral. It fell from 76 on the Oct 29 gap-up to about 47 on Oct 30 and has bounced slightly. That is a full momentum reset with no overbought or oversold condition. [Neutral]
- EMA 13 / EMA 34 (in place of the 20 EMA): EMA13 is $56.57 and EMA34 is $56.39. Price at $56.53 sits just below EMA13, which is minor resistance. EMA13 remains above the rising EMA34, so the short-term trend is intact, and EMA34 is the first dynamic support. [Bullish]
- MACD: Line 0.1075 is below Signal 0.1594, and the histogram is negative at about -0.05. The bearish crossover happened on Oct 30 around 12:30–13:30, and the line is still falling. This is a short-term momentum fade, but the line is still positive. [Bearish]
- Bollinger Bands (20): Upper is $57.28 and lower is $55.85, so the midline is about $56.56. Price is at roughly 48% of the band width, right at the midline. After the Oct 29 push to the upper band, the bands are contracting, which points to consolidation and a possible volatility expansion. [Neutral]
- CMF (20): 0.006 sits inside the ±0.05 neutral zone. It slipped negative during the Oct 29–30 pullback and is now curling back to zero. There is no clear accumulation or distribution. [Neutral]
- ADX (14): 22.9 and falling from 32.8 on Oct 29. +DI at 24.2 is barely above −DI at 21.7 after the two crossed on Oct 30. The trend is weakening and moving toward range conditions, with a slight bull edge. [Weak Trend, slightly bullish]
- Volume: 7.04M is moderate. The heaviest volume came on the Oct 29 gap-up, and the pullback since then has been on average-to-lighter volume. That is typical of a constructive digestion rather than heavy distribution. [Neutral to mildly bullish]
- Longer-term MAs and VWAP: Price is above SMA50 ($55.87) and well above SMA200 ($53.41), about 5.9% higher, with SMA50 still above SMA200 (golden cross intact). Price is just below VWAP ($56.60). [Bullish long-term, neutral short-term]
DIVERGENCES & TRENDS
- There is no clear price/RSI divergence. RSI peaked near 76 on both the Oct 22 and Oct 29 surges and has reset each time, which is healthy.
- MACD is below its signal line while price holds above the 34 EMA. This is a mild short-term momentum divergence, but it looks more like consolidation than a reversal.
- ADX fell from the low 30s to under 23 and the DIs have converged, so the trend is losing steam and the market is moving sideways.
- The larger structure is a series of higher lows (Oct 1 low, Oct 13 dip, Oct 24–27 base), with price trading above both SMAs.
- EMA13 vs EMA34 remains bullish, with no cross. The SMA50/200 golden cross is intact. The MACD bearish cross is the only recent negative crossover.
CHART PATTERNS
- Bullish Pennant / flag-like consolidation (continuation): The Oct 29 gap-up from about $56.1 to $57.1 acts as the pole. Since then price has coiled between $56.36 and $56.98 with narrowing swings. A breakout above about $57.10 projects a measured move of roughly $1.00, to about $58.10.
- Bearish Double Top (reversal) risk: There are repeated failures near $57.0–57.1, and the double-top neckline is near $56.35. A close below that, and then below SMA50 at $55.87, would open a move to about $55.0. This is the lower-probability read, because the broader structure of higher lows remains intact.
- Broader rising channel: Price has risen from the Oct 1 low near $53.4 and sits in the upper part of that channel, supported by the rising SMA50.
POTENTIAL SCENARIOS
- Scenario 1: Bullish Pennant Breakout — Price holds the EMA34/VWAP area, MACD re-crosses up, and price breaks the Oct 29 high. Trigger: close above $57.10 on rising volume. Target: $57.80–$58.10. Invalidation: close below $56.00 (under EMA34 and the pennant floor). (50% probability)
- Scenario 2: Neutral Range-Bound Chop — With ADX below 23, price drifts between the SMA50 and the recent high. Trigger: failure to break either $57.10 or $55.90 for several sessions. Target: $56.30–$56.90. Invalidation: decisive close outside the $55.85–$57.30 band. (25% probability)
- Scenario 3: Bearish Breakdown / Double-Top Failure — The MACD bearish cross extends, and price loses EMA34 and the pennant support. Trigger: close below $56.00 and then $55.87 (SMA50 plus lower Bollinger Band). Target: $55.00–$55.30. Invalidation: reclaim of $56.60 (EMA13/VWAP) with MACD turning up. (25% probability)
PRICE TARGETS
- Target Price: $57.05 (13-day horizon, Nov 14, 2026)
- Expected Range: $54.40 to $58.50 (width $4.10, about 7.3% of the current price, consistent with the 13-day timeframe)
- Key Levels: Support at $55.87 (SMA50 and lower Bollinger Band), Resistance at $57.10 (Oct 29 high, with the upper Bollinger Band at $57.28 just above)
OVERALL BIAS
OVERALL BIAS: BULLISH - Price holds above the rising SMA50 and SMA200 with EMA13 above EMA34, and the post-gap consolidation resembles a bullish pennant. The weakening ADX, MACD bearish cross and neutral CMF cap conviction, so the edge is modest and a breakdown below $55.87 would negate it.
This is educational analysis and not financial advice.