SPY 13-day bearish forecast — Nov 1, 2026
- Bias: Bearish
- Timeframe: 13 days (made Nov 1, 2026, target date Nov 13, 2026)
- Price at analysis: $755.69
- Price target: $747.00
- Expected range: $718.00 – $778.00
- Result: Correct (-0.8%) — closed at $749.47 on Nov 13, 2026; quality score 100/100
Get a free AI analysis of SPY today
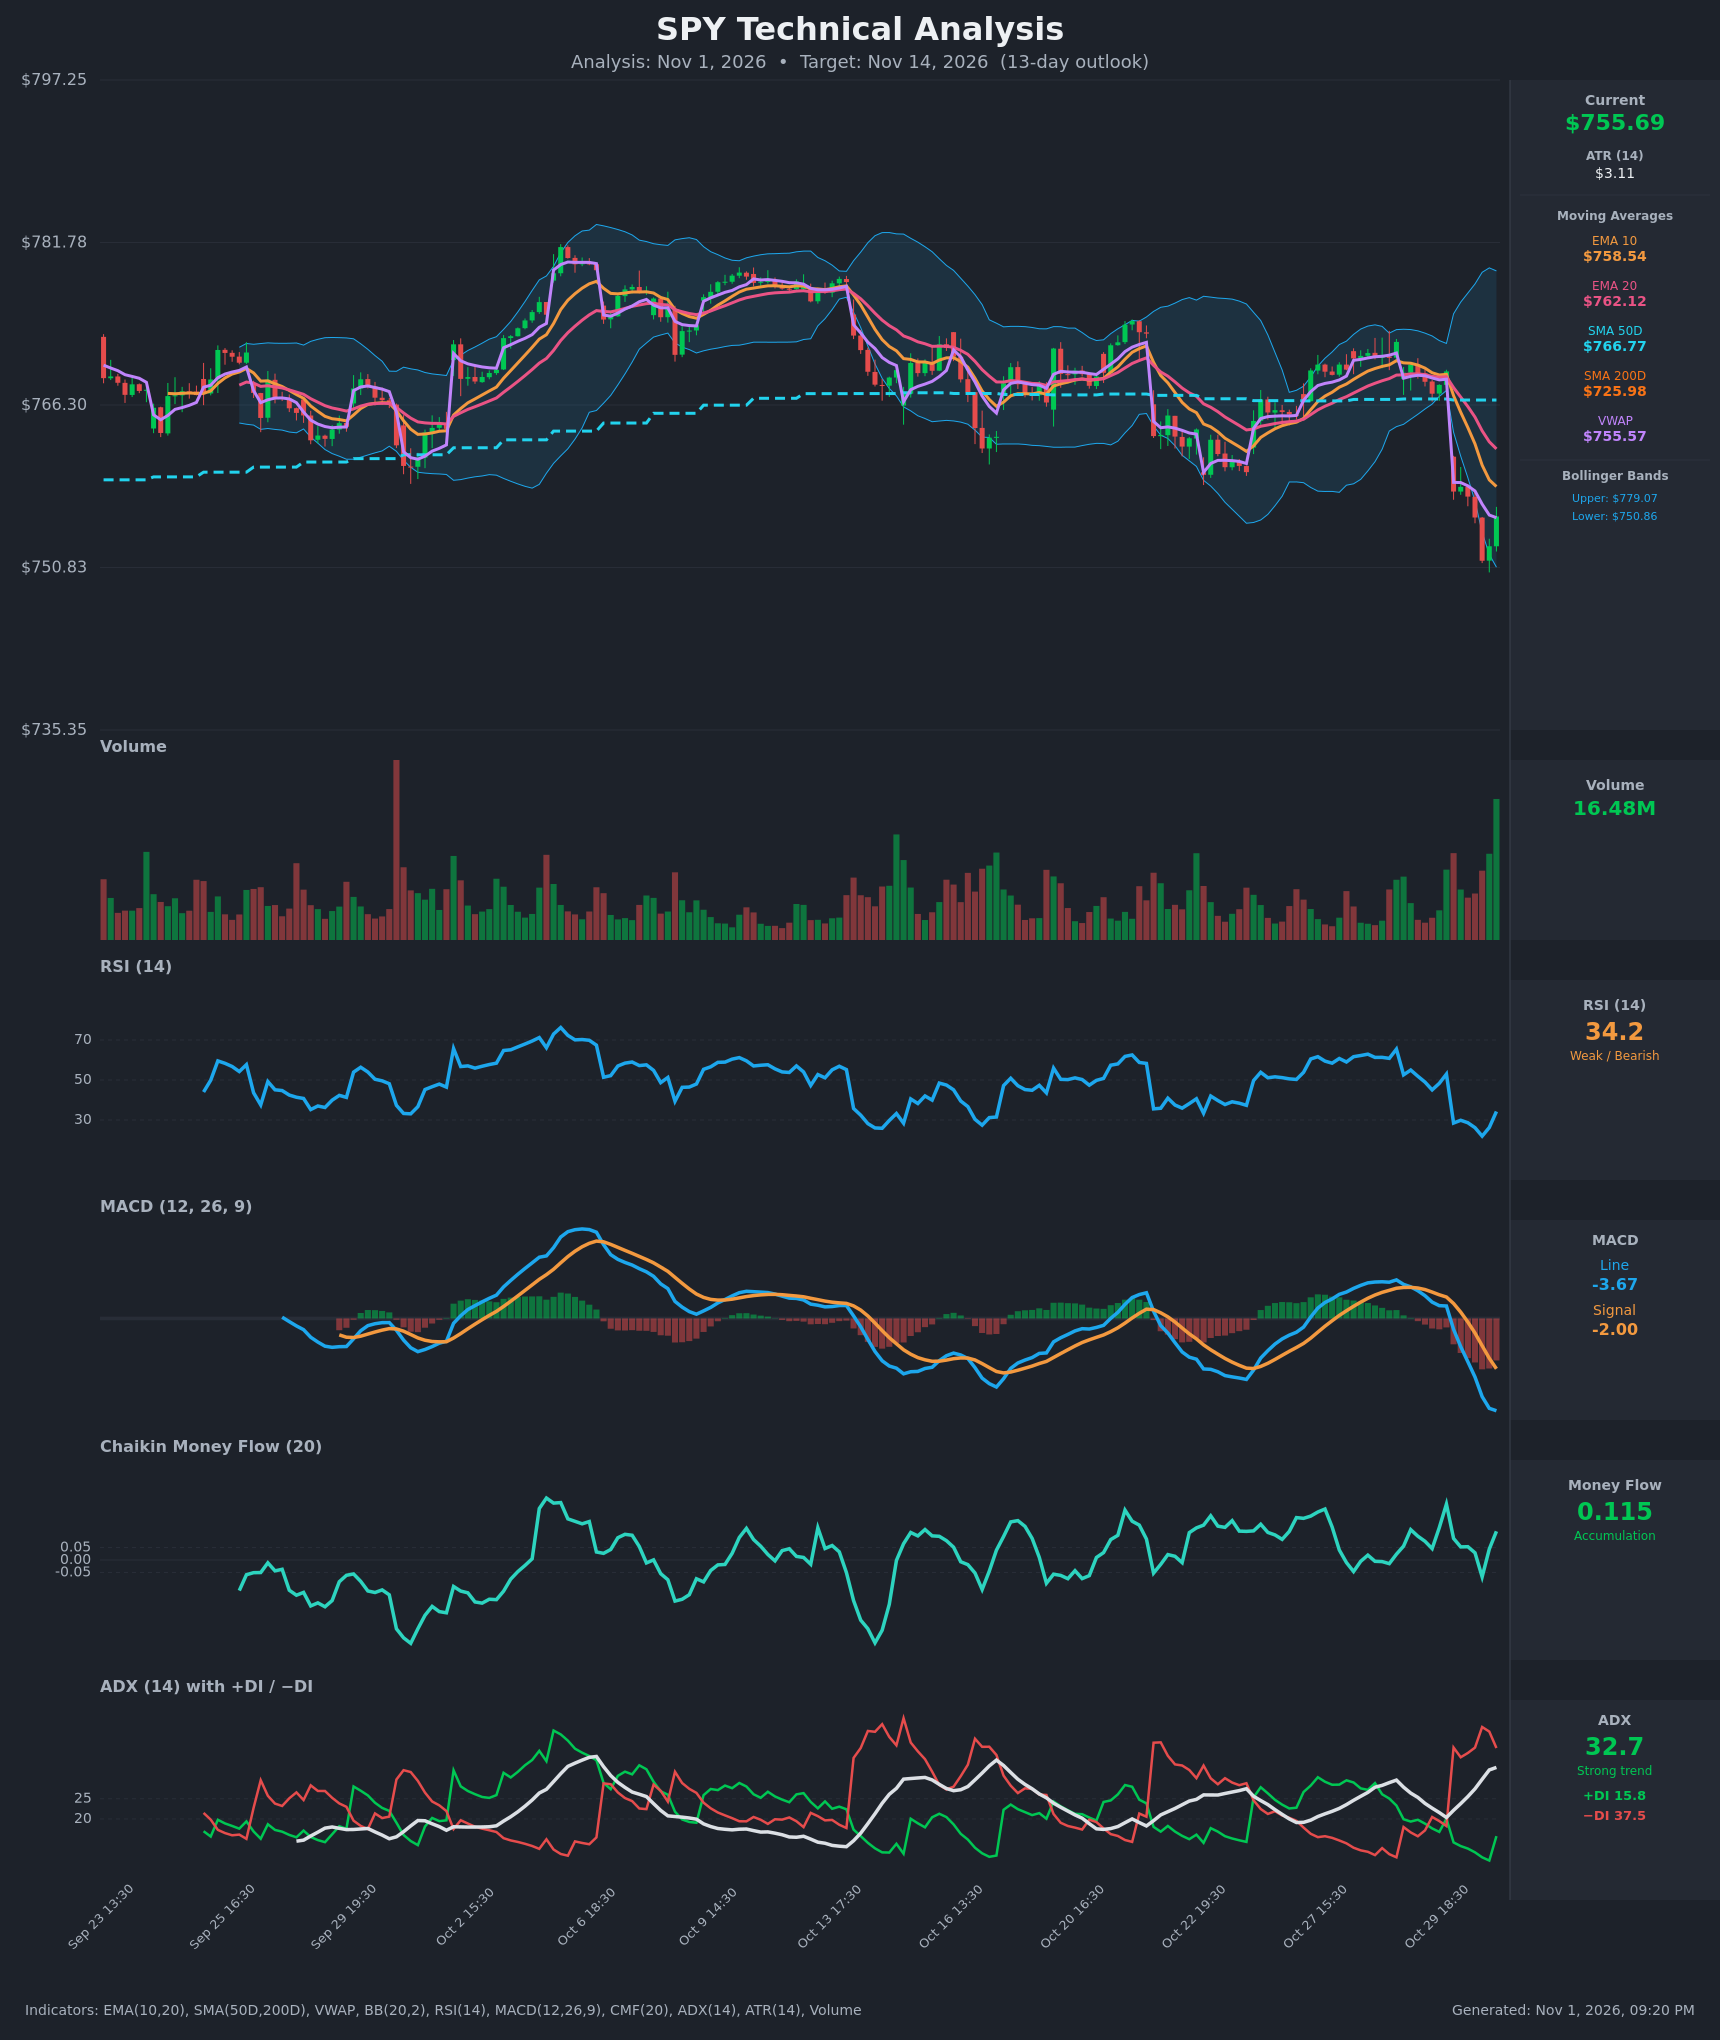
Analysis
TECHNICAL INDICATORS
- RSI (14): 34.25, bouncing from an extreme low of 21.9 on the Oct 30 17:30 bar. It is still below 40 and under the 50 midline, so the bounce is a relief move so far and not yet a momentum shift. [Bearish]
- 20 EMA: $762.12, with price at $755.69 below it. EMA10 ($758.54) is below EMA20 after a bearish cross on Oct 30. Price is also below the SMA50D ($766.77). The EMAs are sloping down and act as layered overhead resistance. [Bearish]
- MACD: Line -3.67 is below Signal -2.00, after a bearish cross on Oct 30 15:30. The histogram is negative and widening. The line is still making new lows, with no bullish cross or flattening yet. [Bearish]
- Bollinger Bands (20): Upper $779.07, lower $750.86. Price is in the lower quarter of the band after the overnight gap down and has tagged the lower band. The bands are expanding, which signals a volatility breakout to the downside. Band-walking is possible, though a bounce back toward the $765 midline is also common after a lower-band tag. [Bearish]
- CMF (20): +0.115, above the +0.05 threshold and rising off -0.068. Buying pressure is building into the selloff, which is a mild positive divergence against price. [Accumulation]
- ADX (14): 32.7 and rising, so the trend is strong. −DI at 37.5 is far above +DI at 15.8, so sellers are firmly in control. +DI has ticked up from 9.7, but the gap is still very wide. [Strong Trend – Bearish]
- Volume: 16.48M on the latest bar is the highest in the recent window, and it came on a green bounce candle. This could be early capitulation or dip-buying, but it is a single bar and needs follow-through. The gap-down session also had elevated volume. [Mixed – possible capitulation, unconfirmed]
Other context:
- VWAP: $755.57, essentially equal to price, so it is a pivot.
- SMA200D: $725.98 is about 4% below, the major long-term support.
DIVERGENCES & TRENDS
- Positive divergence (CMF vs price): CMF is rising (+0.115) while price makes new lows. This hints at dip accumulation, but CMF is volatile and has flipped sign often in recent weeks.
- RSI: It made a higher low (~26 → ~34) against price lows. This is a short-term bounce signal only, not a confirmed divergence. Price is still below its EMAs.
- Trend: ADX is rising from about 20 to 32.7 with −DI dominant, so the downtrend is accelerating. The gap from ~$769.5 to ~$758 on Oct 30 broke the 766–780 range.
- Crossovers:
- Bearish EMA10/EMA20 cross.
- Bearish MACD cross, now well below zero.
- Price lost the SMA50D, which now sits about $11 overhead.
- SMA50D is still well above SMA200D, so there is no death cross; the long-term structure is intact.
CHART PATTERNS
- Loose Bearish Double Top: Peaks near $781 (Oct 6) and $776 (Oct 13), followed by a breakdown through the ~$758–760 neckline zone. The measured move of roughly $22–25 projects to about $735, though the pattern is not textbook-clean.
- Range breakdown: Price had been consolidating between about $755 and $781, and has now broken below it on a gap. Failure to reclaim $762–766 would confirm a bearish continuation.
- Counter-pattern: If $750 holds and price reclaims $762, the move would be a failed breakdown / bear trap, with an upside target toward the $766–770 range.
POTENTIAL SCENARIOS
- Scenario 1: Bearish Trend Continuation — The bounce stalls beneath EMA20/SMA50D and sellers push price below the $750.5 swing low, extending the double-top breakdown. Trigger: rejection at $758–$762, then a close below $750. Target: $747 on the 13-day horizon, with an extension toward $735 and then SMA200D at $726. Invalidation: a sustained close above $766.77 (SMA50D). (50% probability)
- Scenario 2: Bullish Relief Rally / Bear Trap — Oversold RSI, positive CMF, a lower-band tag and a high-volume bounce bar produce a mean-reversion move back to the middle of the prior range. Trigger: reclaim of $762 (EMA20) with MACD histogram contraction. Target: $766–$772. Invalidation: a close below $750. (35% probability)
- Scenario 3: Neutral Base-Building — Price chops between $750 and $762 as the bounce and the downtrend offset each other. Trigger: low-volume inside days with ADX flattening. Target: $752–$760. Invalidation: a close outside $750–$762. (15% probability)
PRICE TARGETS
- Target Price: $747.00 (13-day horizon)
- Expected Range: $718.00 to $778.00 (width $60 ≈ 7.9% of current price, scaled for 13 days: wider than a 2–3 day range of ~3% and about the 8% lower bound for a ~2-week horizon)
- Key Levels: Support at $750.83 (lower Bollinger Band / recent swing low), Resistance at $762.12 (EMA20, with SMA50D at $766.77 above it)
OVERALL BIAS
OVERALL BIAS: BEARISH - ADX is rising above 30 with −DI far above +DI. MACD and the EMAs have crossed bearishly, and the range broke down on a gap. Price remains below all short-term resistance. The oversold RSI and positive CMF argue for a bounce first, but the weight of trend evidence favors a continuation lower.
This is educational analysis and not financial advice.