CRWV 13-day bearish forecast — Nov 1, 2026
- Bias: Bearish
- Timeframe: 13 days (made Nov 1, 2026, target date Nov 13, 2026)
- Price at analysis: $54.98
- Price target: $52.50
- Expected range: $48.50 – $58.50
- Result: Correct (-5.9%) — closed at $51.75 on Nov 13, 2026; quality score 100/100
Get a free AI analysis of CRWV today
Analysis
TECHNICAL INDICATORS
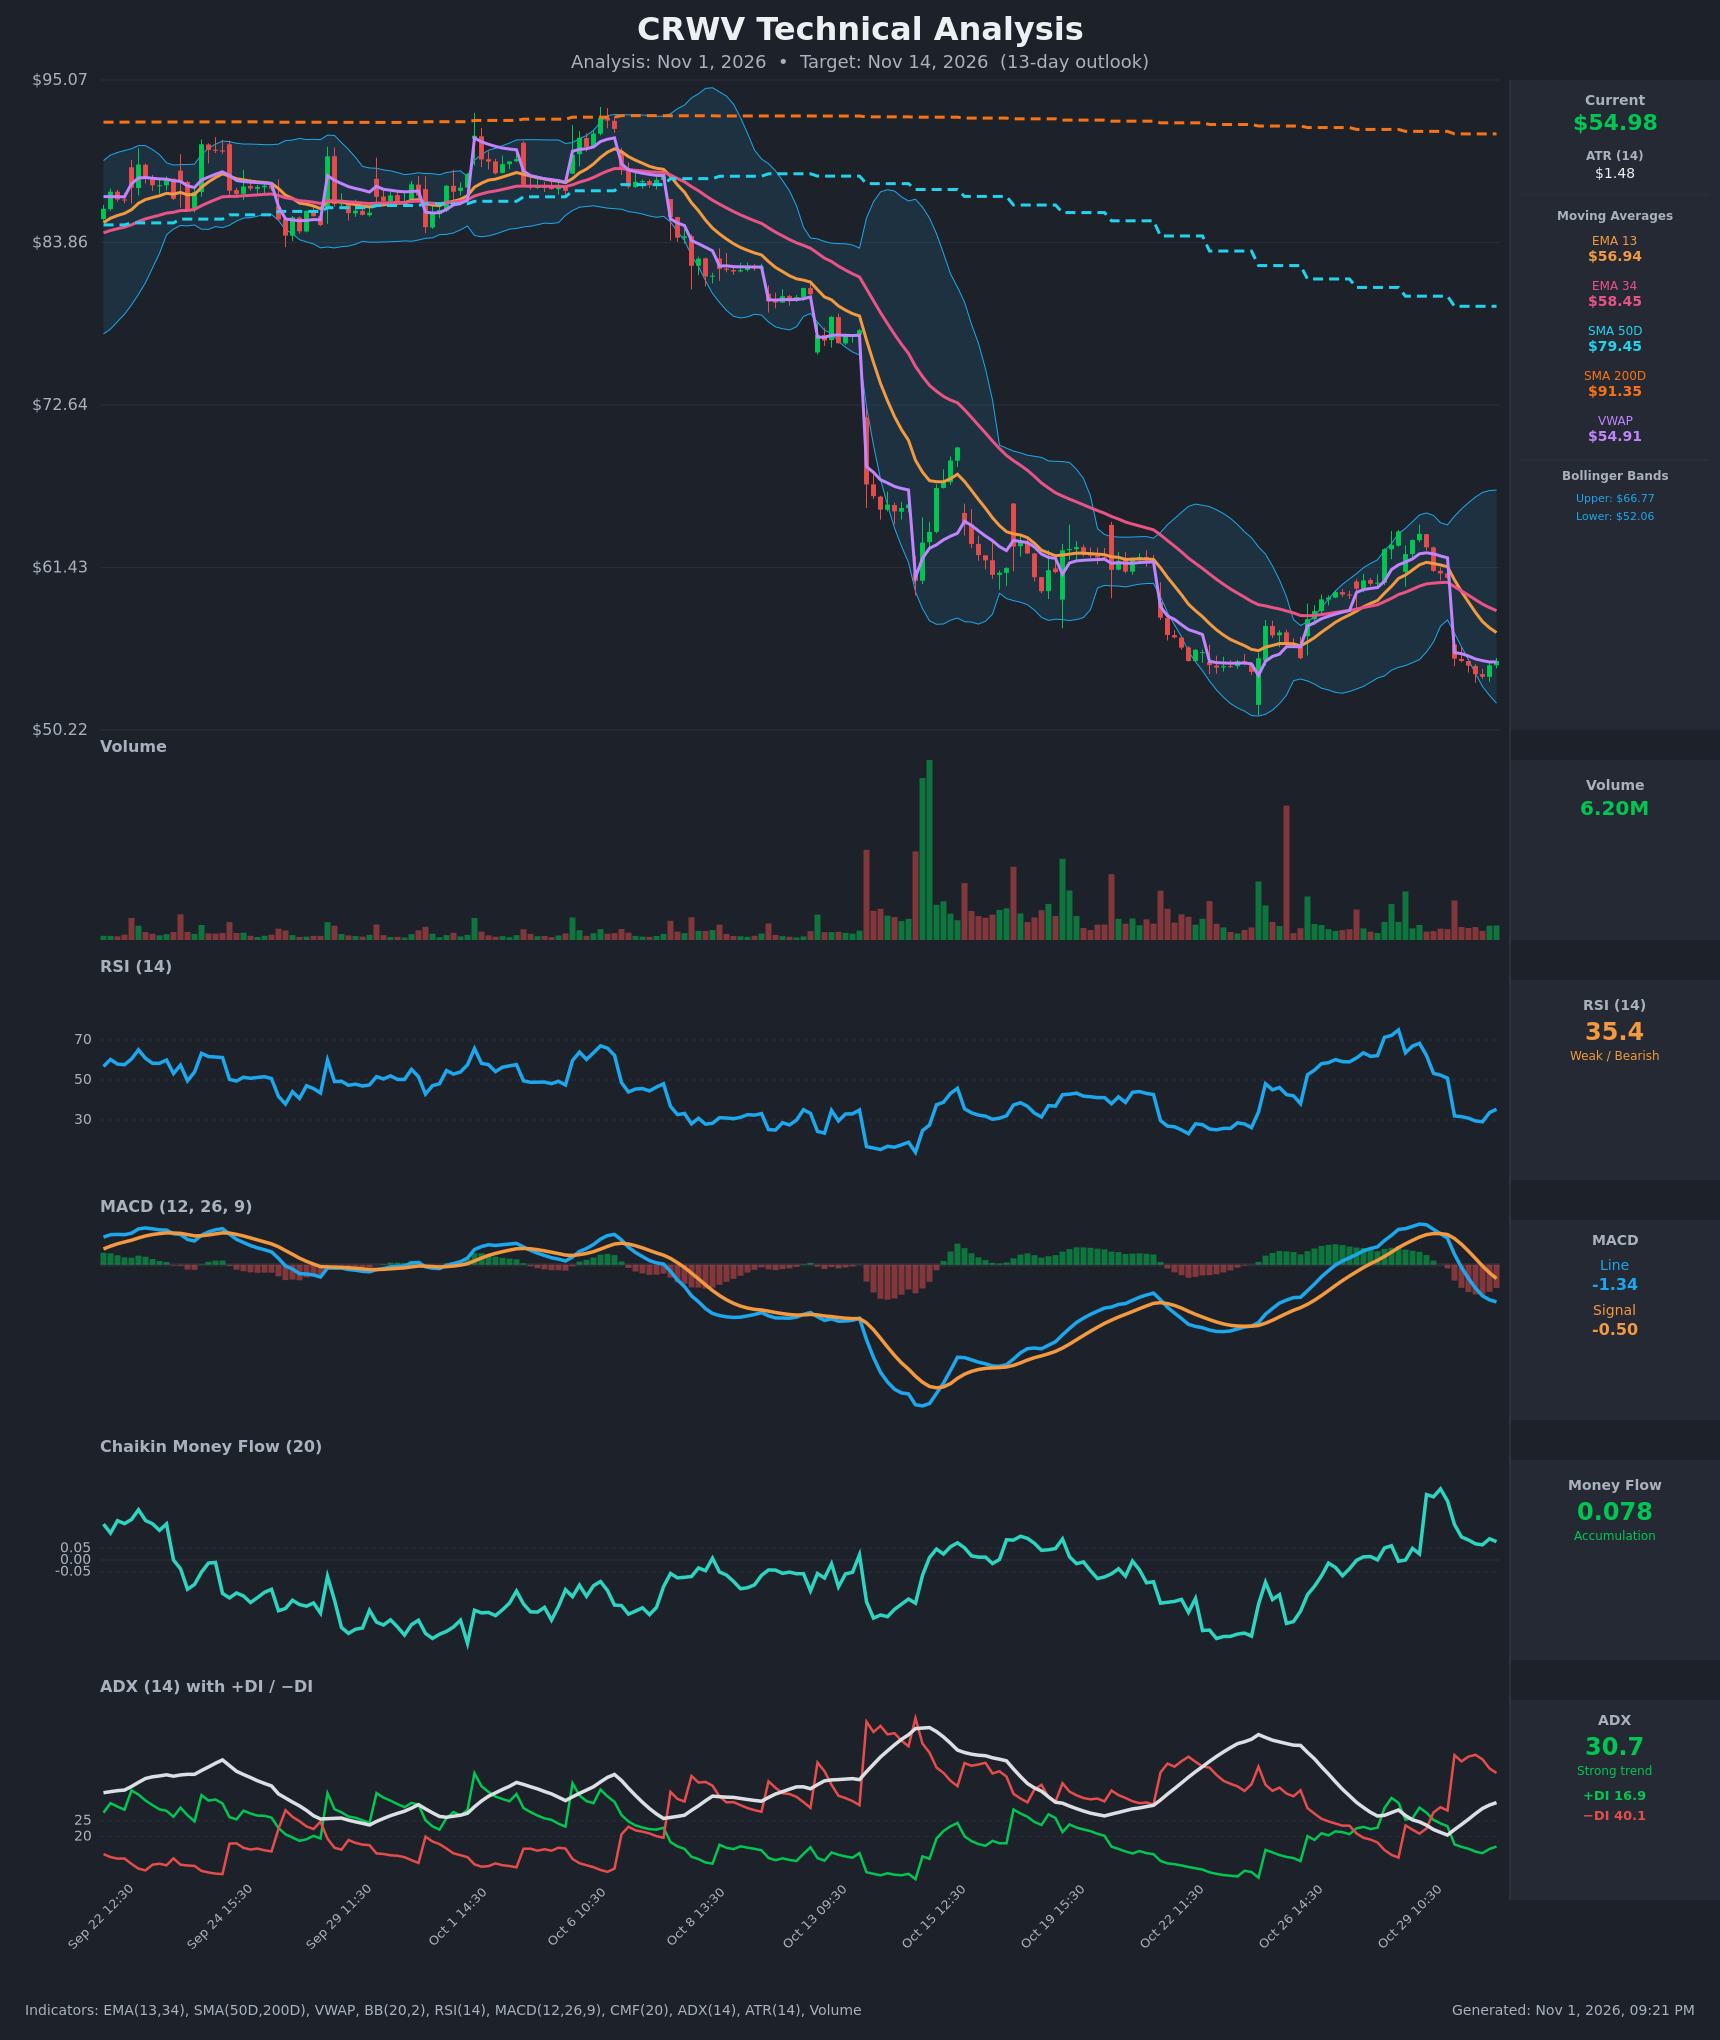
- RSI (14): 35.39, rolling over from 75 on Oct 28 and now bouncing off the 29-30 zone. It is not yet oversold, and it is still below 50, so momentum is weak with only a tentative uptick. [Bearish]
- 20 EMA: The data gives EMA 13 at $56.94 and EMA 34 at $58.45. Price at $54.98 is below both, and both are sloping down, so they act as overhead resistance. EMA13 is below EMA34 (bearish cross on Oct 30). [Bearish]
- MACD: Line -1.34 is below signal -0.50 after a bearish cross on Oct 30 (around 13:30). The histogram is negative and still widening, so downside momentum is accelerating. [Bearish]
- Bollinger Bands (20): Upper $66.77, lower $52.06, so price is in the lower third of the bands. The bands are wide after the volatile swing from $54 to $65 and back. A gap-down opened below the VWAP and EMAs, and price sits about $2.90 above the lower band. This is a walk-the-lower-band setup with a possible mean-reversion bounce. [Bearish]
- CMF (20): 0.078, which is mild accumulation. It has faded from its spike above 0.30 on Oct 29, so buying pressure is waning. This is a mild divergence against the price decline. [Accumulation]
- ADX (14): 30.7 and rising, with -DI at 40.1 far above +DI at 16.9. This is a strong downtrend with bears firmly in control. [Strong Trend - Bearish]
- Volume: 6.20M on the latest bar, which is moderate and below the capitulation spikes of mid-October. The Oct 30 gap-down came without a washout-volume climax, so selling may not be exhausted. [Neutral to Bearish]
Moving-average structure:
- Price is far below SMA50D ($79.45) and SMA200D ($91.35), which confirms a long-term downtrend.
- SMA50D is below SMA200D (death-cross regime).
- Price is just below VWAP ($54.91, effectively at it).
DIVERGENCES & TRENDS
- Bullish divergence (minor): CMF stays positive (+0.078) while price makes a lower low near $53.89. Money flow has not confirmed the decline, which hints at dip-buying.
- RSI: It made a higher low (about 29 vs. a prior 25 in mid-October), but the move from the Oct 28 overbought reading to 29 shows momentum is fragile.
- Crossovers: A bearish MACD cross and a bearish EMA13/34 cross both occurred on Oct 30, and -DI dominates +DI. The lower-high structure from the $65 peak is intact.
- Gap: Price gapped from $60.72 to $55.14 on Oct 30. The gap has not been filled, and the gap zone ($60-61) is resistance.
- Trend: The primary downtrend is intact, with a lower high at about $65 versus the prior rally highs and a base near $52-54.
CHART PATTERNS
- Bearish flag / rising channel: The rally from about $52 to $65 in late October looks like a counter-trend bounce within the larger downtrend. The failure and gap-down match a bearish continuation, a bearish rising wedge/flag breakdown from the reference diagram.
- Potential double bottom (bullish reversal): Price is revisiting the $52-54 low from Oct 23-24, so a Bullish Double Bottom is possible. It is not confirmed until a close above the roughly $65 neckline, so it is only a lower-probability alternative.
- Measured move: The channel breakdown from about $65 points toward the prior low near $52, with a break targeting about $48-50.
POTENTIAL SCENARIOS
- Scenario 1: Bearish Continuation Toward Prior Lows — The strong ADX, -DI dominance, bearish MACD, and rejection at the declining EMAs favor a retest and probable break of the $52-53 lows. Trigger: a hourly close below $53.80, then a break of the lower band at $52.06. Target: $49-51. Invalidation: a close above $58.50 (EMA34). (50% probability)
- Scenario 2: Neutral Base and Bounce Within Range — Price holds the double-bottom zone near $52-54 and mean-reverts toward the EMAs as CMF stays positive and RSI lifts from near-oversold. Trigger: a hold of $52.50 and a push above $56.94 (EMA13). Target: $57-59. Invalidation: a close below $52. (30% probability)
- Scenario 3: Bullish Double-Bottom Reversal — A volume-backed rally fills part of the gap and challenges the $60-61 resistance. Trigger: a close above $58.50 with MACD histogram turning up. Target: $61-63. Invalidation: a rejection at $58.50 and a drop back below $54. (20% probability)
PRICE TARGETS
For the 13-day timeframe, the range width is about 8-12% of price. The ATR of $1.48 implies a typical daily move of about 2.7%, so a range of around $6.50 (about 12%) is justified.
- Target Price: $52.50 (for 13 days from now)
- Expected Range: $48.50 to $58.50 (width $10.00, about 18%, which is wider because of the high-volatility regime and the gap risk, and is well wider than a 2-3 day range)
- Key Levels: Support at $52.06 (lower Bollinger Band; below it, $50.22 chart floor), Resistance at $56.94 (EMA13, then $58.45 EMA34)
OVERALL BIAS
OVERALL BIAS: BEARISH - ADX at 30.7 with -DI at 40.1 versus +DI at 16.9, a fresh bearish MACD cross, price below all moving averages, and a gap-down below the EMAs point to continued downside toward $52 or lower. CMF accumulation and a near-oversold RSI argue for bounces, but they are not enough to override the trend.
This is educational analysis and not financial advice.