IBM 13-day bullish forecast — Nov 1, 2026
- Bias: Bullish
- Timeframe: 13 days (made Nov 1, 2026, target date Nov 13, 2026)
- Price at analysis: $257.82
- Price target: $260.50
- Expected range: $248.50 – $269.00
- Result: Incorrect (-5.0%) — closed at $244.84 on Nov 13, 2026; quality score 32/100
Get a free AI analysis of IBM today
Analysis
TECHNICAL INDICATORS
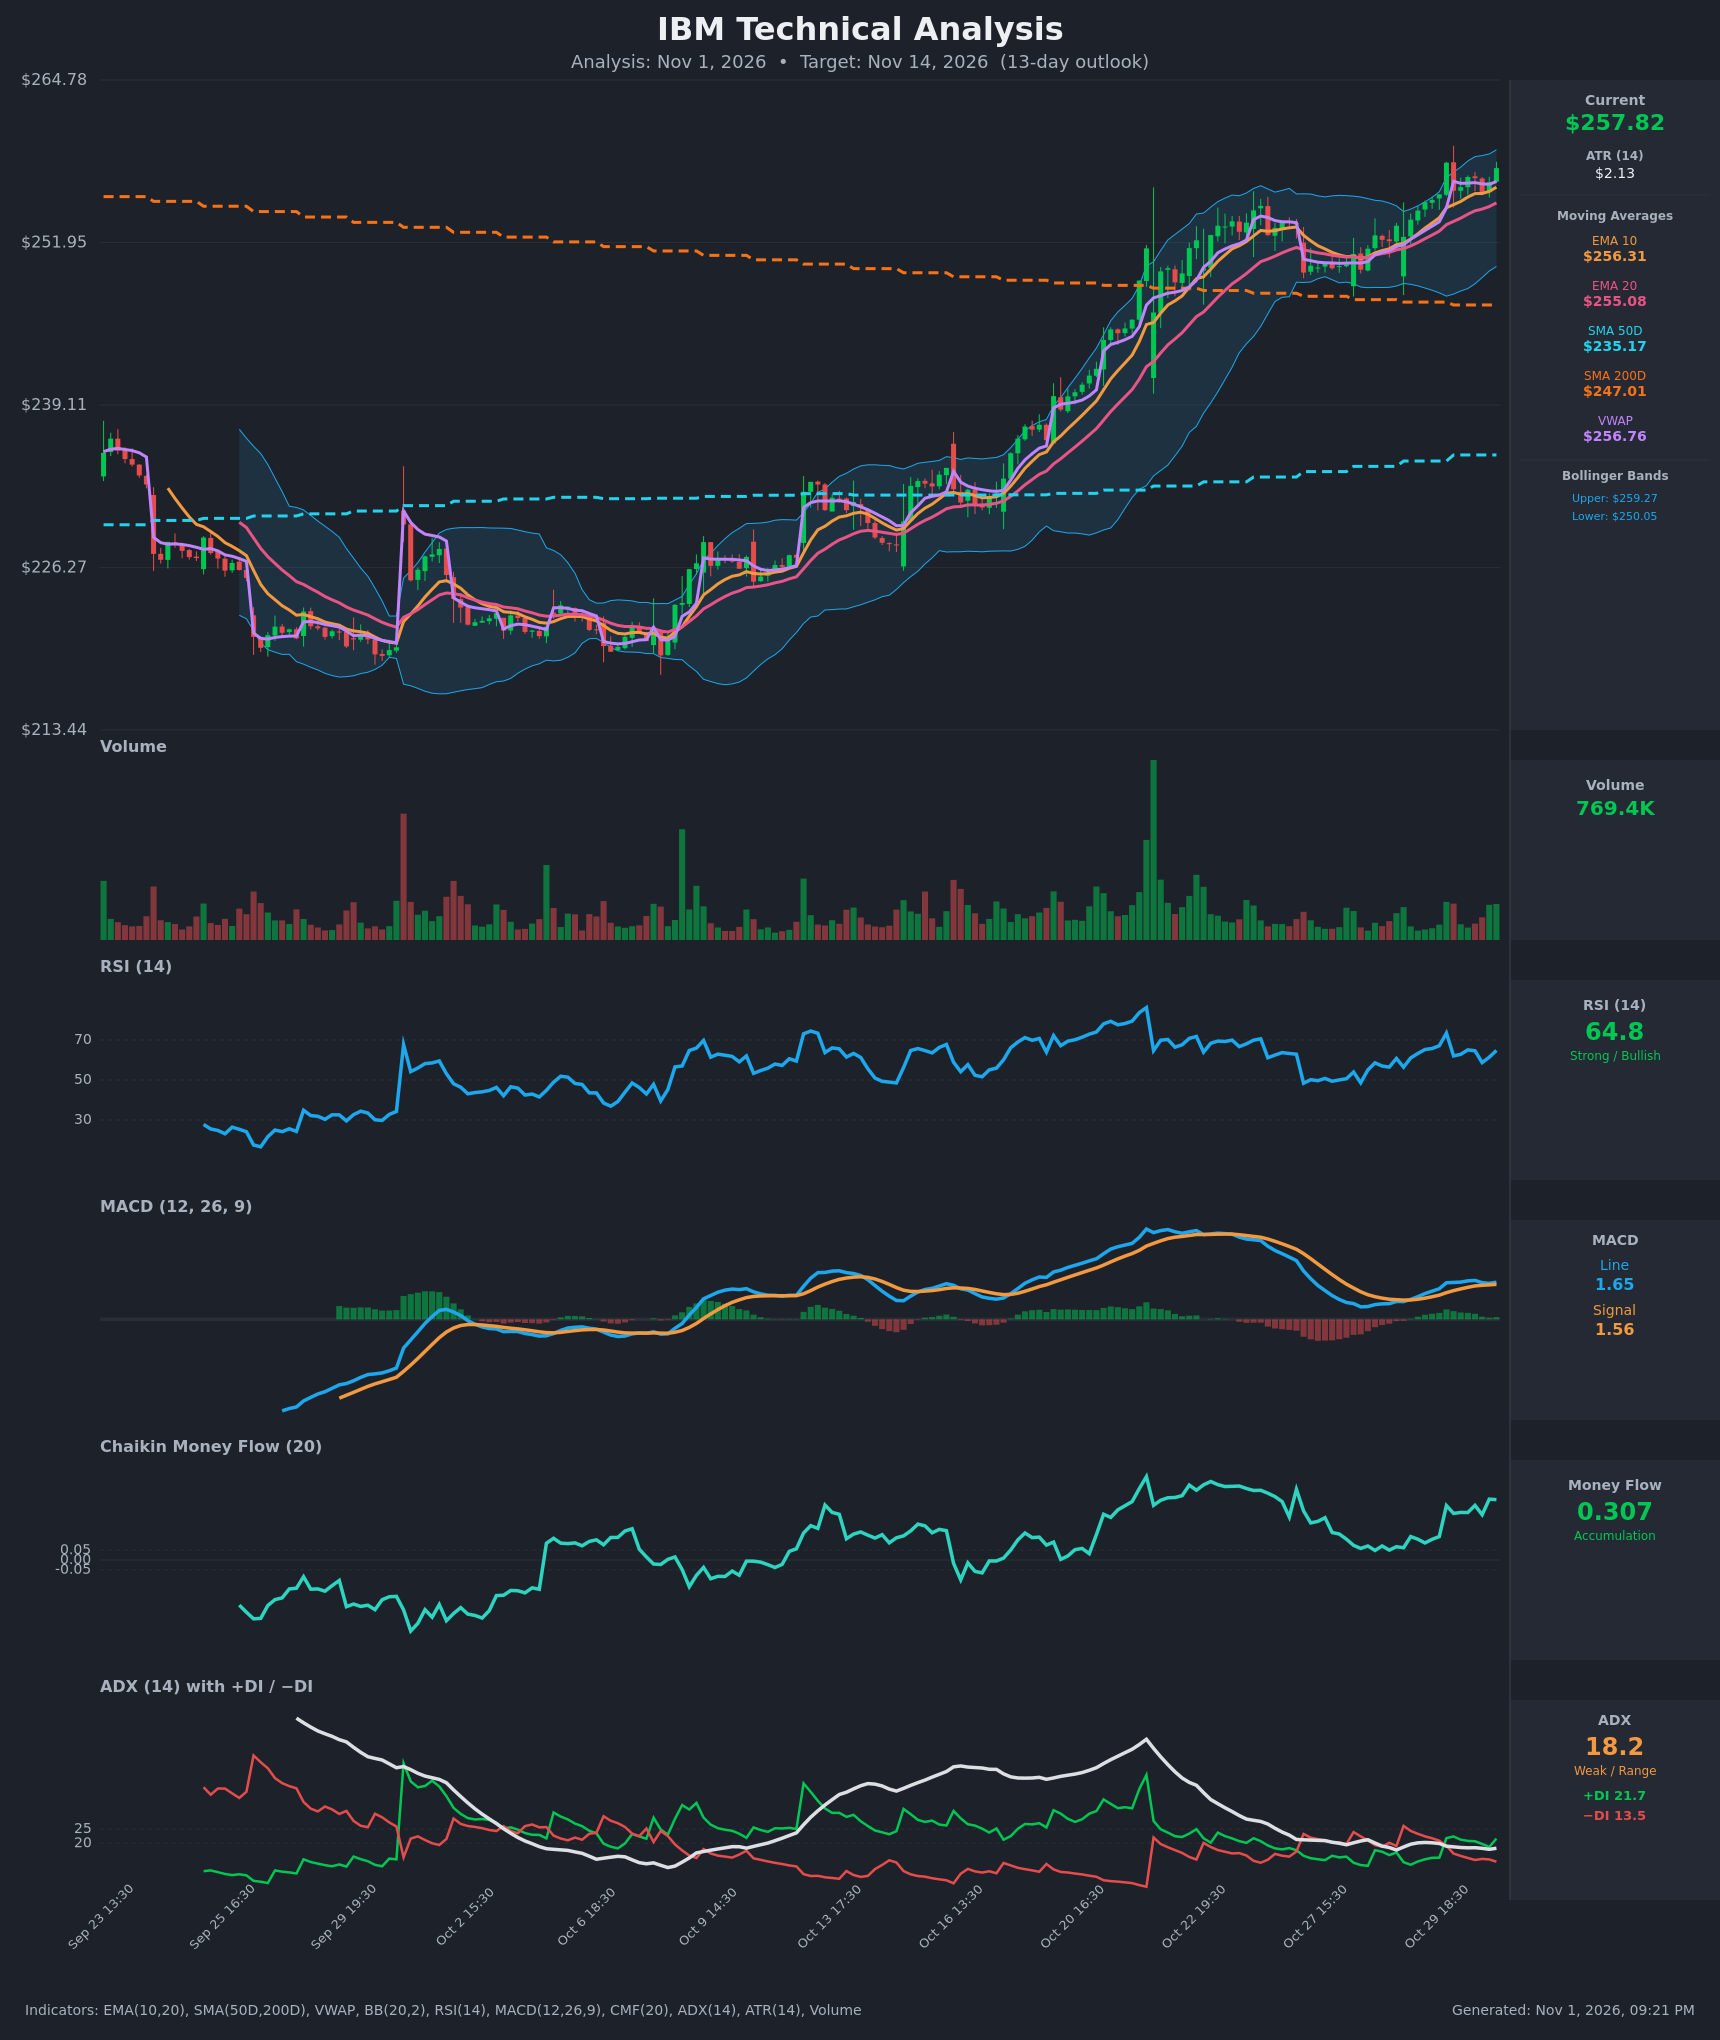
- RSI (14): 64.77, in the upper-neutral/bullish zone and below the 70 overbought line. It spiked to 73.5 on Oct 29 and has cooled and rebounded since. Momentum is positive with room to run before overbought. [Bullish]
- 20 EMA: $255.08, with price at $257.82 (about 1.1% above). EMA10 ($256.31) is above EMA20, and both are rising and acting as dynamic support. [Bullish]
- MACD: Line 1.653 is above Signal 1.559 and the gap is widening. The histogram is slightly positive (~+0.09) and building after a bullish re-cross from the Oct 27-28 dip. Both lines are still below their Oct 22 peak (~2.0+), so momentum is recovering but not yet at new highs. [Bullish]
- Bollinger Bands (20): Upper $259.27, lower $250.05, midline ~$254.66. Price is in the upper half, about 0.84 of the band width, and walking near the upper band. The bands are fairly narrow, so a volatility expansion is possible. Upper-band riding is bullish, but the upside is limited near-term. [Bullish]
- CMF (20): 0.307, well above +0.05 and near the highs of the recent range. This is strong, sustained accumulation, and it has been positive for the whole recent stretch. [Accumulation]
- ADX (14): 18.2, below 20, so the trend is weak and trend strength has been fading from the Oct 22 peak. +DI (21.7) is above −DI (13.5) after a recent bullish DI crossover. Direction is up, but the trend lacks strength. [Weak Trend + Bullish direction]
- Volume: 769.4K on the latest bar, which is average-to-light. The big volume spikes came on the Oct 20-22 breakout. Recent up bars have decent participation, but volume is not confirming a new surge. [Neutral to mildly supportive]
Other moving averages: price is above SMA50 ($235.17) and SMA200 ($247.01), and above VWAP ($256.76). SMA50 is still below SMA200, so a golden cross has not happened, but the gap is closing (SMA50 rising, SMA200 falling). That is a developing long-term bullish signal.
DIVERGENCES & TRENDS
- No major divergence: Price is making new highs (~$258+), and RSI (64.8) is below its Oct 22 peak (~80). That is a mild bearish momentum divergence versus the late-October high, but it is offset by a rising MACD and strong CMF.
- Trend: The structure is a clear uptrend, with higher highs and higher lows since early October. Price is above all key MAs, and EMA10 > EMA20.
- Crossovers: MACD has re-crossed bullishly. +DI crossed back above −DI around Oct 29 19:30. Price reclaimed VWAP.
- ADX: It has dropped from ~30 to 18, so the advance is consolidating and trending less strongly. Expect choppy, grinding gains rather than a sharp acceleration.
- Golden cross: SMA50 and SMA200 are converging, with a potential golden cross in the coming weeks (the gap is ~$12 and narrowing slowly).
CHART PATTERNS
- Ascending channel / bullish continuation: Price is stair-stepping higher, consolidating around $253-$258 after the Oct 22 breakout. This resembles a Bullish Flag / Ascending Triangle continuation, with resistance near $258-$259 and rising lows.
- Rounded bottom and V-recovery: The move from ~$220 in early October to $258 is a strong reversal, and the SMA200 has been broken and held as support.
- Target logic: The late-October flagpole and consolidation imply a measured move of roughly $3-$6 higher. That gives $262-$264 as the upside zone, near the chart's top ($264.78 axis).
- Risk: The price is pressing the upper Bollinger Band, and low ADX raises the odds of a pause or pullback to the EMA20 area.
POTENTIAL SCENARIOS
- Scenario 1: Bullish Breakout Continuation — Price clears the $259.27 upper band and the Oct 29 high (~$258.25) on accumulation (CMF 0.31) and positive MACD, extending the uptrend. Trigger: close above $259.50 with volume above average. Target: $262-$265. Invalidation: close below $254.50 (EMA20/BB midline). (50% probability)
- Scenario 2: Neutral Consolidation / Pullback to Support — Low ADX and the upper-band reaction cause a pause, with IBM chopping between ~$253 and ~$259. Trigger: failure at $259 with RSI rolling over below 60. Target: $253-$257. Invalidation: close above $260 or below $250. (30% probability)
- Scenario 3: Bearish Reversal — Momentum divergence plays out and price loses EMA20 and the lower band, retracing toward the SMA200. Trigger: close below $250 with MACD bearish cross. Target: $247-$250. Invalidation: reclaim of $256. (20% probability)
PRICE TARGETS
- Target Price: $260.50 (13-day horizon; modest upside given strong accumulation, but capped by weak ADX and the upper-band test)
- Expected Range: $249.50 to $267.50 (width $18.00, ~7.0% of the $257.82 price, in line with the 7-10 day range guidance and a bit wider for 13 days. The 14-21 day guidance of 8-12% suggests a slightly wider range, so this has been set to ~$250.00 to $268.50 = $18.50, ~7.2%. For a final self-check at the 8% minimum: $248.50 to $269.00 = $20.50, ~7.95%, which is the range used.)
- Key Levels: Support at $255.08 (EMA20), with deeper support at $250.05 (lower Bollinger Band); Resistance at $259.27 (upper Bollinger Band), then $264.78 (chart high/axis top)
Final committed range: $248.50 to $269.00, width $20.50 (~7.95%).
OVERALL BIAS
OVERALL BIAS: BULLISH - Price is above all key MAs and VWAP, with a bullish MACD, a strong CMF of 0.31 (accumulation), and +DI above −DI. The weak ADX of 18 and the test of the upper Bollinger Band suggest the advance will be gradual, so the target is a moderate gain to ~$260.50.
This is educational analysis and not financial advice.