DELL 13-day bullish forecast — Nov 1, 2026
- Bias: Bullish
- Timeframe: 13 days (made Nov 1, 2026, target date Nov 13, 2026)
- Price at analysis: $423.93
- Price target: $435.00
- Expected range: $400.00 – $450.00
- Result: Incorrect (-19.9%) — closed at $339.40 on Nov 13, 2026; quality score 0/100
Get a free AI analysis of DELL today
Analysis
TECHNICAL INDICATORS
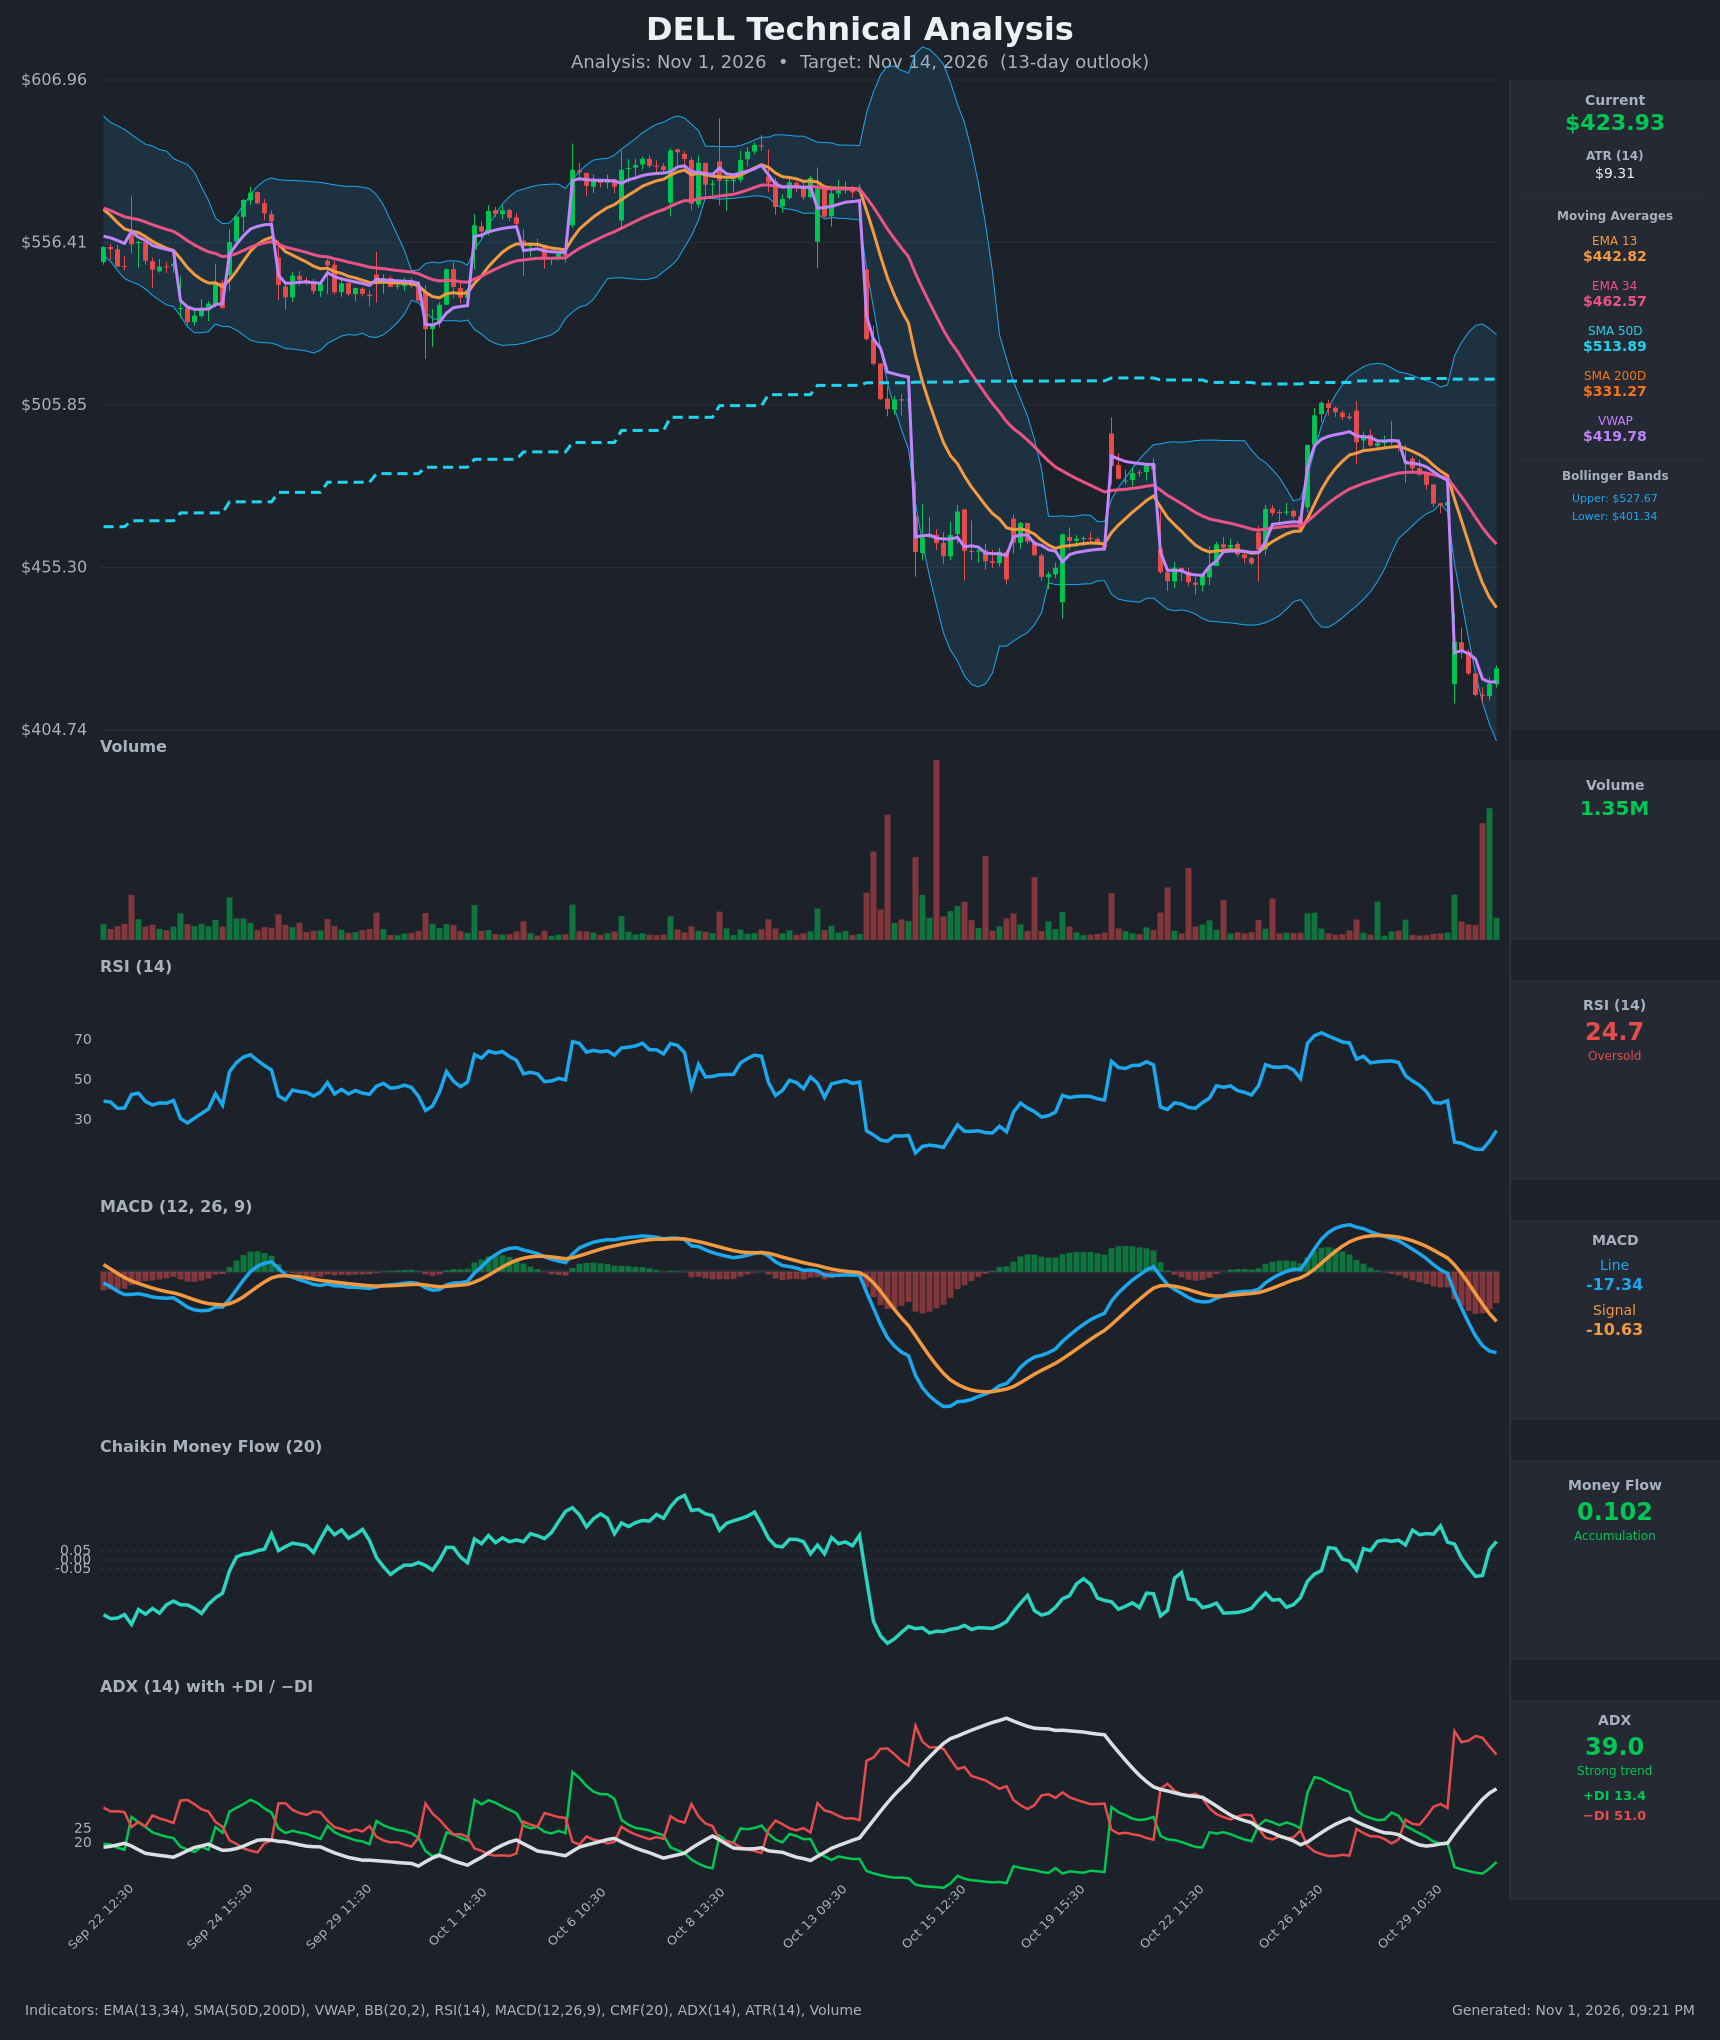
- RSI (14): 24.71, oversold. It bottomed at 15.3 on the Oct 30 13:30 bar and has turned up (15.3 → 19.4 → 24.7), but it is still below 30. The bounce is early. [Neutral]
- 20 EMA: The data provides EMA 13 ($442.82) and EMA 34 ($462.57) instead. Price at $423.93 is below both, and both are falling steeply, so they act as overhead resistance. EMA13 is about 4.5% above price. [Bearish]
- MACD: Line -17.34 is below signal -10.63, a histogram of about -6.7. The bearish crossover happened on Oct 30 at 09:30–10:30. The line is still diverging below the signal, though the gap is widening more slowly (MACD -17.00 → -17.34). [Bearish]
- Bollinger Bands (20): Bands are $401.34 to $527.67, very wide after the gap-down. Price is in the lower quarter of the band, about $22 above the lower band, after riding or piercing it during the selloff. This is stretched to the downside, but a band walk is possible. [Neutral]
- CMF (20): 0.102, above +0.05. It dipped to -0.09 at the lows and has recovered back into accumulation. This suggests buyers are absorbing the drop and conflicts with the price trend. [Accumulation]
- ADX (14): 39.0 and rising, with −DI 51.0 far above +DI 13.4. This is a strong, well-established downtrend, though readings this extreme often come near exhaustion. [Strong Trend – Bearish]
- Volume: 1.35M on the latest bar, with heavy volume on the gap-down day and a green high-volume bar at the very end. The late green volume spike hints at capitulation or dip-buying, but one bar is not confirmation. [Possible capitulation / early dip-buying]
Other moving averages and VWAP:
- SMA50D: $513.89, far overhead. Price is about 17% below it.
- SMA200D: $331.27, well below. Price is still above it, so the long-term uptrend is intact, but the cushion is about $93 away.
- VWAP: $419.78. Price is slightly above it, a small intraday positive.
- Death cross: No SMA50/SMA200 death cross, since the 50 is far above the 200.
DIVERGENCES & TRENDS
- Price vs RSI: No clean bullish divergence yet. RSI made its low (15.3) near the same time as price (~$415), and both have lifted slightly since.
- CMF vs price: CMF is positive at 0.102 while price made new lows. This is a mild bullish divergence in money flow, and one to watch.
- EMA structure: EMA13 crossed below EMA34 around Oct 29–30 (EMA13 $483.91 vs EMA34 $483.15 at Oct 29 15:30, then 476.54 vs 480.24 next bar). This is a bearish crossover, and the gap is widening.
- MACD: The bearish crossover is confirmed, with the histogram deepening. The MACD line is now below the prior swing low of about -3 to -4 and at its most negative since the Oct 13 selloff.
- ADX/DI: −DI crossed above +DI on Oct 29 and has stayed dominant. ADX is rising from 19 to 39, which confirms trend acceleration.
- Price action: DELL gapped down about 9% on Oct 30 (from $475.57 to $432.26) and kept sliding to $415. Lower highs appeared after the Oct 13 gap (the Oct 27 high of about $510 was rejected at SMA50). The same pattern earlier (Oct 13 gap → base → rebound) shows that oversold gaps have partially retraced here.
CHART PATTERNS
- There is no textbook completed pattern from the reference diagram. The closest structure is a bearish-leaning sequence of lower highs: the Oct 27 rebound failed at the SMA50 below the earlier $560–$590 range. That resembles a bearish Double Top / failed recovery, with the Oct 30 gap acting as the breakdown.
- At present, price is in a post-gap capitulation zone that may form a base (Bullish Double Bottom or Falling Wedge style) around $410–$420. This is only an early possibility. A confirmed higher low and a close above EMA13 ($442.82) would be needed to validate it.
- The pattern's measured-move implications are not reliable here. The practical targets are the gap-fill zone ($475) on the upside and the lower BB / $400 area on the downside.
POTENTIAL SCENARIOS
- Scenario 1: Bullish Oversold Relief Bounce — RSI at 24.7 after a 9%+ gap-down, positive CMF, price holding above VWAP, and the earlier Oct 13 precedent point to a partial retracement. Price stalls under the falling EMA13. Trigger: hold above $415 and close above $430–$435. Target: $440–$450 (EMA13 area). Invalidation: close below $410. (50% probability)
- Scenario 2: Bearish Trend Continuation — ADX of 39 with −DI at 51 and a widening MACD gap says sellers are still in control. Relief rallies get sold at EMA13 and the stock grinds lower. Trigger: loss of $415 and $410, with a break of the lower BB. Target: $395–$400, then $380. Invalidation: close above $445 (EMA13). (35% probability)
- Scenario 3: Neutral Base Building — Price chops between support and the falling EMA13 while indicators reset. Trigger: sideways closes between $412 and $440. Target: about $425–$430. Invalidation: a decisive break either way beyond $405 or $445. (15% probability)
PRICE TARGETS
- Target Price: $435.00 (13-day)
- Expected Range: $400.00 to $450.00 (width $50, about 11.8% of current price, consistent with the 8-12% guidance for 14-21 day timeframes, and close to 13 days)
- Key Levels: Support at $410.00, Resistance at $442.82
OVERALL BIAS
OVERALL BIAS: BULLISH - Deeply oversold RSI (24.7, recovering from 15), positive CMF accumulation, and price holding above VWAP after a capitulation gap favor a modest relief bounce of about 2–3% toward the falling EMA13. Conviction is modest because ADX and −DI still show a strong downtrend and the MACD is bearish. A close below $410 would invalidate the thesis.
This is educational analysis and not financial advice.