GOOGL 13-day bearish forecast — Nov 1, 2026
- Bias: Bearish
- Timeframe: 13 days (made Nov 1, 2026, target date Nov 13, 2026)
- Price at analysis: $279.76
- Price target: $272.00
- Expected range: $260.00 – $286.00
- Result: Incorrect (+5.1%) — closed at $293.90 on Nov 13, 2026; quality score 16/100
Get a free AI analysis of GOOGL today
Analysis
TECHNICAL INDICATORS
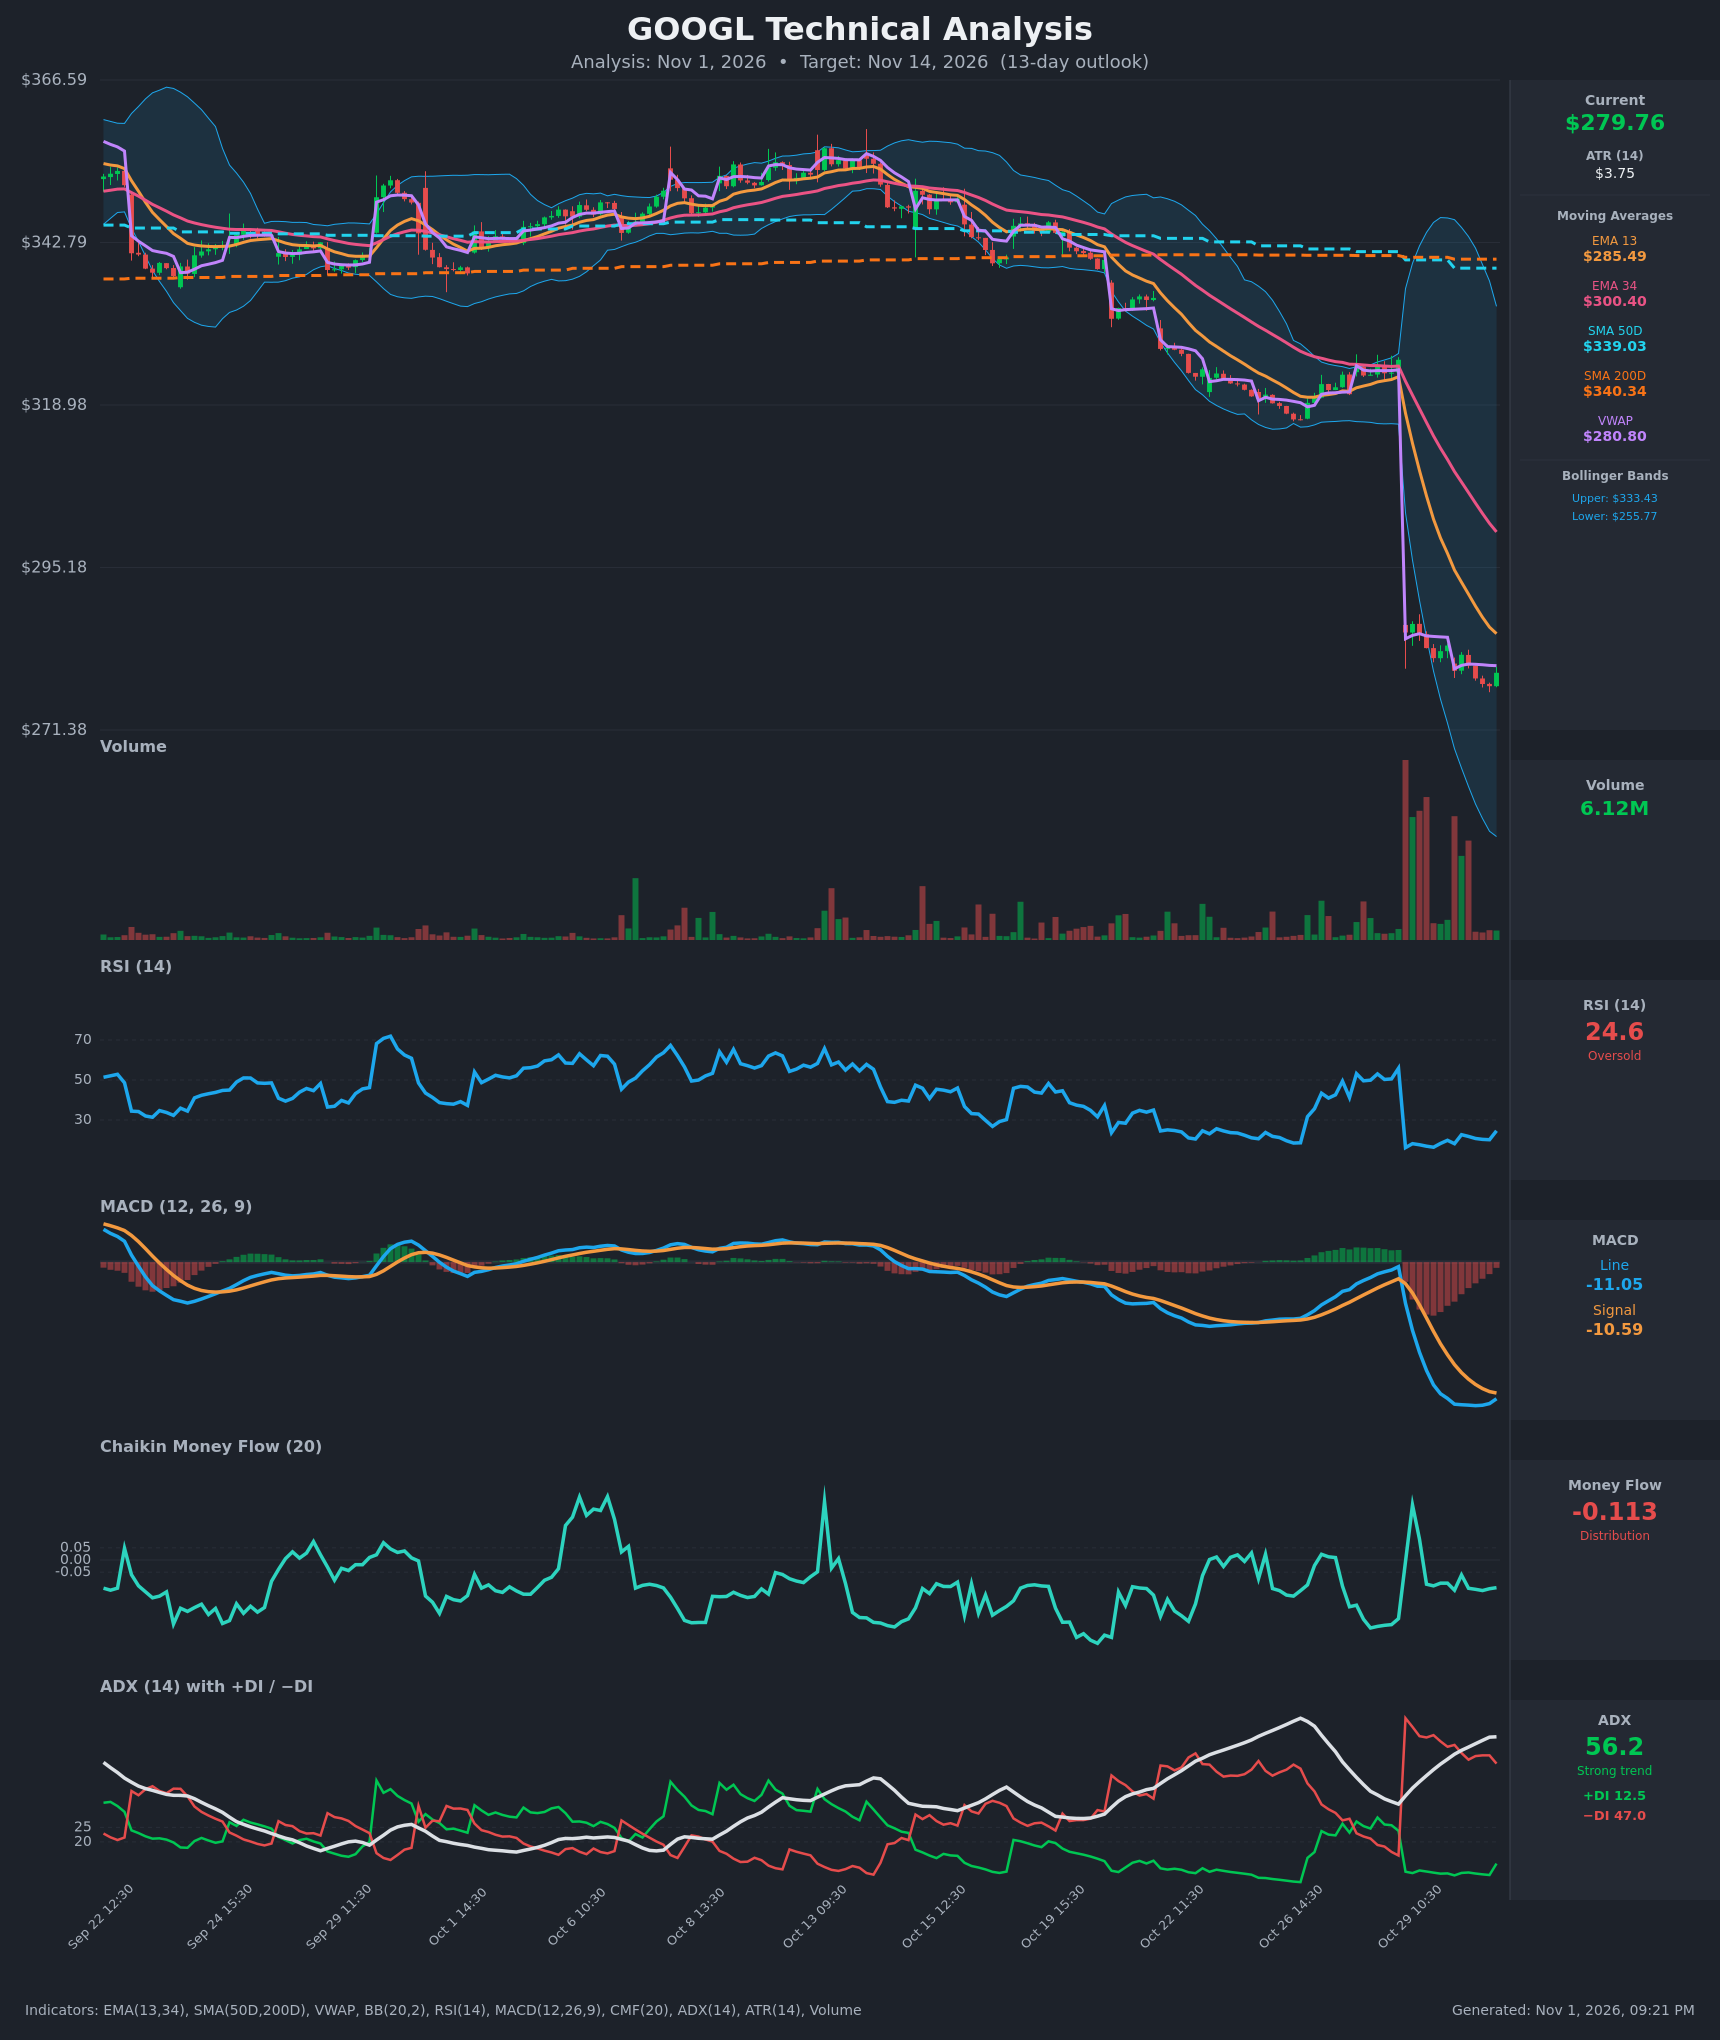
- RSI (14): 24.60, deeply oversold. It plunged to 16 on the Oct 29 gap and has only bounced to the low 20s. It has made no move back toward 30 yet, which shows weak recovery momentum. [Bearish] (oversold, so bounce risk is elevated)
- 20 EMA: The chart shows EMA 13 at $285.49 and EMA 34 at $300.40, both sloping down steeply. Price ($279.76) is below both, and EMA 13 sits just overhead as first resistance. EMA 13 crossed below EMA 34 during the decline. [Bearish]
- MACD: Line -11.05, signal -10.59, histogram about -0.46. The line is below the signal, but the histogram is shrinking as the line flattens, an early sign of selling momentum fading. There is no bullish crossover yet. [Bearish] (improving)
- Bollinger Bands (20): Upper $333.43, lower $255.77, and the bands are very wide after the gap. Price is in the lower half of the bands, about $24 above the lower band, so it is not "riding" the band. Volatility is expanded, and mean reversion toward the middle band would be a large move. [Bearish]
- CMF (20): -0.113, below the -0.05 threshold. It has been persistently negative apart from a brief spike on the gap day, so selling pressure dominates. [Distribution]
- ADX (14): 56.2 and still rising. −DI (47.0) is far above +DI (12.5), although +DI ticked up from 8.6. This is a very strong, well-established downtrend. ADX above 50 can also mark an exhaustion zone. [Strong Trend – Bearish]
- Volume: 6.12M, far below the huge spikes on the Oct 29 gap. The recent down bars are on shrinking volume, so panic selling has cooled, but there is no volume-backed reversal either. [Neutral-to-Bearish: fading selling pressure, no accumulation]
DIVERGENCES & TRENDS
- There is no confirmed bullish divergence. RSI has been flat around 18–24 while price made marginally lower lows (277.80 vs 281.91), so RSI is not clearly diverging.
- The MACD histogram is contracting, a mild positive momentum shift. It needs a line/signal crossover to matter.
- Price is far below SMA 50D ($339.03) and SMA 200D ($340.34). SMA 50D has crossed below SMA 200D, a death cross, and both are now flat and acting as distant resistance.
- VWAP ($280.80) sits just above price, so sellers still control the intraday tape. A reclaim of VWAP and $285.49 would be the first sign of stabilization.
- The Oct 29 gap-down (about -12% from $325.61 to $285.67) was followed by lower highs and a drift lower, which is typical post-earnings-gap behavior.
CHART PATTERNS
- Bearish Flag / Pennant (continuation): After the sharp gap-down "pole", price has consolidated in a tight $277.80–$287 range with lower highs. This resembles the Bearish Flag/Pennant in the reference diagram. The measured move would be far lower (the pole is about $40), but with RSI this oversold I treat that as a stretch target.
- Gap-down with partial consolidation: The gap zone ($286–$325) acts as heavy overhead supply. A full gap fill is unlikely within 13 days.
- A Falling Wedge / Double Bottom is not confirmed. The lows at about $278 are close together, but there is no breakout above $287 yet.
POTENTIAL SCENARIOS
- Scenario 1: Bearish Flag Continuation — Price fails at EMA 13/VWAP (about $281–$286) and slides to retest and break the $277.80 low as the strong downtrend (ADX 56, −DI 47) persists. Trigger: close below $277.80. Target: $268–$272, with an extension toward the $260 area near the lower Bollinger Band ($255.77). Invalidation: close above $287. (45% probability)
- Scenario 2: Bullish Oversold Relief Bounce — RSI near 25 with a narrowing MACD histogram sparks a mean-reversion bounce toward the declining EMAs. Trigger: reclaim of VWAP/EMA 13 ($285.50) on rising volume. Target: $292–$300 (EMA 34 at $300.40). Invalidation: close below $277. (40% probability)
- Scenario 3: Neutral Range Base — Price chops between $277 and $286 as selling exhausts and buyers have not yet taken control. Trigger: no break of either boundary. Target: about $280. Invalidation: a close outside $277–$287. (15% probability)
PRICE TARGETS
Timeframe: 13 days (Nov 14, 2026). ATR is $3.75, so a 13-day typical move is about ±$13.5 (3.75 × √13).
- Target Price: $272.00
- Expected Range: $260.00 to $286.00 (width $26 = about 9.3% of current price, consistent with the 8–12% guidance)
- Key Levels: Support at $277.80, Resistance at $285.49
OVERALL BIAS
OVERALL BIAS: BEARISH - Price is below every moving average, −DI dominates (47 vs 12.5) with ADX at 56, CMF shows distribution, and the post-gap consolidation looks like a bearish flag with lower highs. The oversold RSI (24.6) and the narrowing MACD histogram make a relief bounce a real risk (a sizable minority probability), so conviction is modest.
This is educational analysis and not financial advice.