IBIT 13-day bearish forecast — Nov 1, 2026
- Bias: Bearish
- Timeframe: 13 days (made Nov 1, 2026, target date Nov 13, 2026)
- Price at analysis: $43.35
- Price target: $42.60
- Expected range: $40.90 – $44.80
- Result: Correct (-10.9%) — closed at $38.61 on Nov 13, 2026; quality score 56/100
Get a free AI analysis of IBIT today
Analysis
TECHNICAL INDICATORS
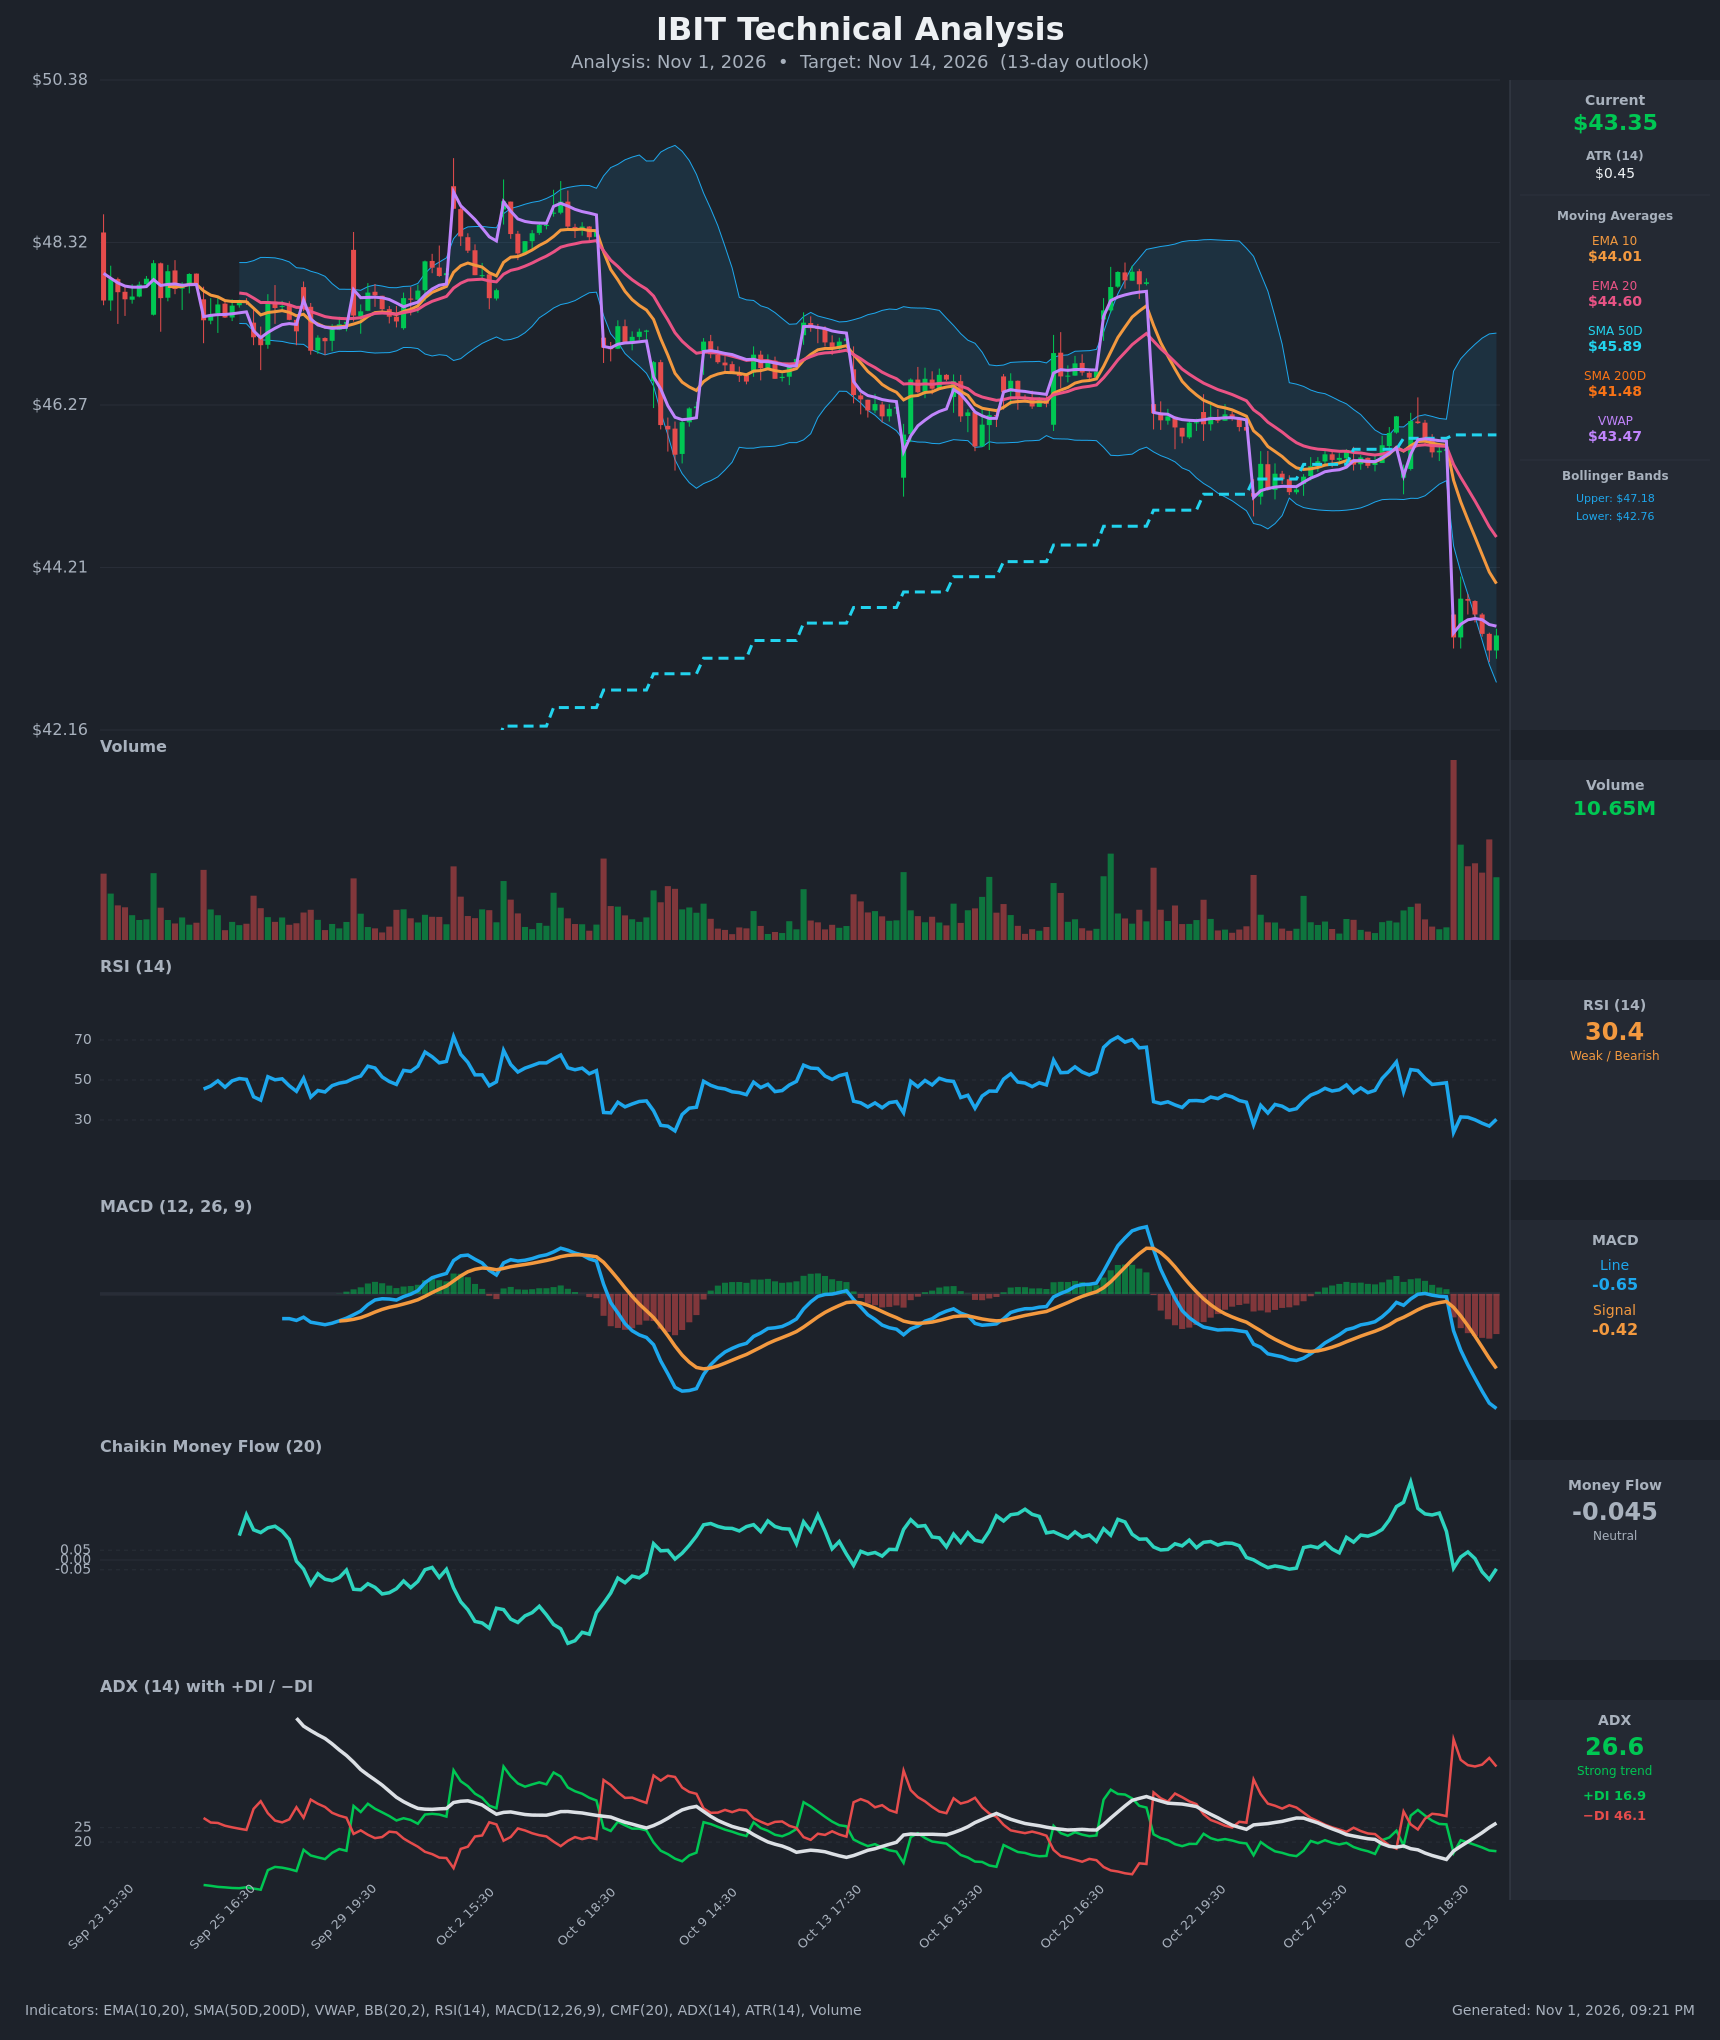
- RSI (14): 30.36, right at the oversold line. It fell from about 48.6 to 23.8 on the Oct 30 gap, bounced to roughly 31, and has since made lower readings (27.0 before the latest uptick). Momentum is still pointing down, though the oversold level raises the odds of a relief bounce. [Bearish]
- 20 EMA: $44.60, with the EMA10 at $44.01. Price at $43.36 is below both, and both are sloping down steeply. The EMA10 crossed below the EMA20 on Oct 30. The EMAs now act as overhead resistance. [Bearish]
- MACD: Line -0.647 is below the signal at -0.421, a bearish crossover that occurred on Oct 30. The histogram is negative and widening, so downside momentum is still expanding. [Bearish]
- Bollinger Bands (20): Upper $47.18, lower $42.76. Price at $43.36 sits in the lower quarter of the band, about $0.60 above the lower band. The bands are wide after the gap, and the lower band is only about 1.4% below price. Price is not yet "walking the band", but it is pressing toward it. [Bearish]
- CMF (20): -0.045, down from about +0.30 a few sessions ago. It has slipped just under zero but is still inside the ±0.05 neutral zone. The swing from strong accumulation to mild distribution shows buyers stepping back. [Neutral]
- ADX (14): 26.6 and rising, with −DI at 46.1 far above +DI at 16.9. The trend is strong and bears are firmly in control. The −DI/+DI spread of about 29 points is very wide. [Strong Trend – Bearish]
- Volume: 10.65M, with a large volume spike on the Oct 30 gap-down bar and elevated volume since. Heavy volume on the breakdown confirms real selling. The gap bar could also mark a partial capitulation, so a dead-cat bounce is possible. [Bearish confirmation, with some capitulation risk]
Other levels:
- VWAP: $43.47, just above price (price is slightly below VWAP). [Mildly Bearish]
- SMA50D: $45.89, well overhead.
- SMA200D: $41.48, about 4.3% below price and the major long-term support. Price is still above it, and the SMA50 is above the SMA200, so there is no death cross.
DIVERGENCES & TRENDS
- There is no bullish RSI divergence yet. RSI is making lower lows alongside price, so momentum confirms the decline.
- MACD turned down sharply, and the line is well below zero and below the signal. The gap down broke the Oct 22–29 consolidation near $45.5–46.1.
- The EMA10 crossed below the EMA20 (a bearish short-term crossover). The −DI jumped above +DI and has stayed there. ADX is turning up from 14 to 26.6, so the trend is gaining strength.
- CMF flipped from strongly positive (about +0.30 to +0.40) to slightly negative. That confirms the shift from accumulation to distribution.
- Price is under VWAP, all short-term EMAs and the SMA50, and above only the SMA200. That is a deteriorating medium-term structure.
- The one counter-signal is RSI near 30 with price near the lower Bollinger Band. This is a classic setup for a relief bounce toward the EMA10 and VWAP, but it is not a reversal signal on its own.
CHART PATTERNS
- Bearish Pennant / Bearish Flag (continuation): The drop from about $48 to about $45.7 was followed by a tight, low-volatility consolidation in the $45.5–46.1 range, which then broke down on the gap. This fits the bearish pennant/flag template. A measured move of the earlier flagpole (about $2–2.5) from the breakdown near $45.7 points to roughly $43.2–43.7. Price is already there, so the pattern target is largely met. Extension toward the SMA200 at $41.48 would need further selling.
- Gap-down breakdown: The gap from $45.71 to $43.33 leaves an unfilled gap. Gaps like this often act as overhead resistance, with $44.0–45.7 as the fill zone.
- There is no valid reversal pattern yet. A Bullish Falling Wedge or Double Bottom would need to form near $42.7 or $41.5 first.
POTENTIAL SCENARIOS
- Scenario 1: Bearish Trend Continuation toward the Lower Band and SMA200 — Sellers remain in control (−DI 46 vs +DI 17, MACD still widening). Price fails to reclaim VWAP and the EMA10, then grinds lower through the lower Bollinger Band. Trigger: a close below $42.76 (lower BB) with continued −DI dominance. Target: $42.60 on a base case, with $41.50 (SMA200) as the extension. Invalidation: a daily close above $44.60 (EMA20). (50% probability)
- Scenario 2: Bullish Oversold Relief Bounce — RSI near 30 and price at the lower band set up mean reversion toward the EMA10 and EMA20, partially filling the gap. Trigger: a reclaim of VWAP ($43.47) and a close above $44.01 (EMA10), with RSI back above 40. Target: $44.60–45.00. Invalidation: a close below $42.76. (35% probability)
- Scenario 3: Neutral Basing Around $42.8–44.0 — Price stabilizes between the lower band and the EMA10 while ADX flattens. Trigger: a series of small-range sessions with declining volume. Target: $43.00–43.80. Invalidation: a break outside $42.60–44.60. (15% probability)
PRICE TARGETS
- Target Price: $42.60 (13-day, about 1.7% below the current $43.355)
- Expected Range: $40.90 to $44.80 (width $3.90, about 9.0% of current price, consistent with the roughly 8–10% guidance for a 13-day horizon)
- Key Levels: Support at $41.48 (SMA200D, with minor support at the $42.76 lower Bollinger Band), Resistance at $44.01 (EMA10, with further resistance at $44.60 EMA20 and the gap fill near $45.70)
OVERALL BIAS
OVERALL BIAS: BEARISH - The gap-down breakdown has price below every short-term moving average and VWAP. MACD and the EMA10/EMA20 are in bearish crossovers, and ADX is rising at 26.6 with −DI far above +DI. The oversold RSI (30) makes a relief bounce likely along the way, but the trend favors a drift toward the lower band and possibly the SMA200 over the next 13 days.
This is educational analysis and not financial advice.