MSFT 13-day bearish forecast — Nov 1, 2026
- Bias: Bearish
- Timeframe: 13 days (made Nov 1, 2026, target date Nov 13, 2026)
- Price at analysis: $521.90
- Price target: $515.50
- Expected range: $496.00 – $537.00
- Result: Correct (0.0%) — closed at $521.71 on Nov 13, 2026; quality score 100/100
Get a free AI analysis of MSFT today
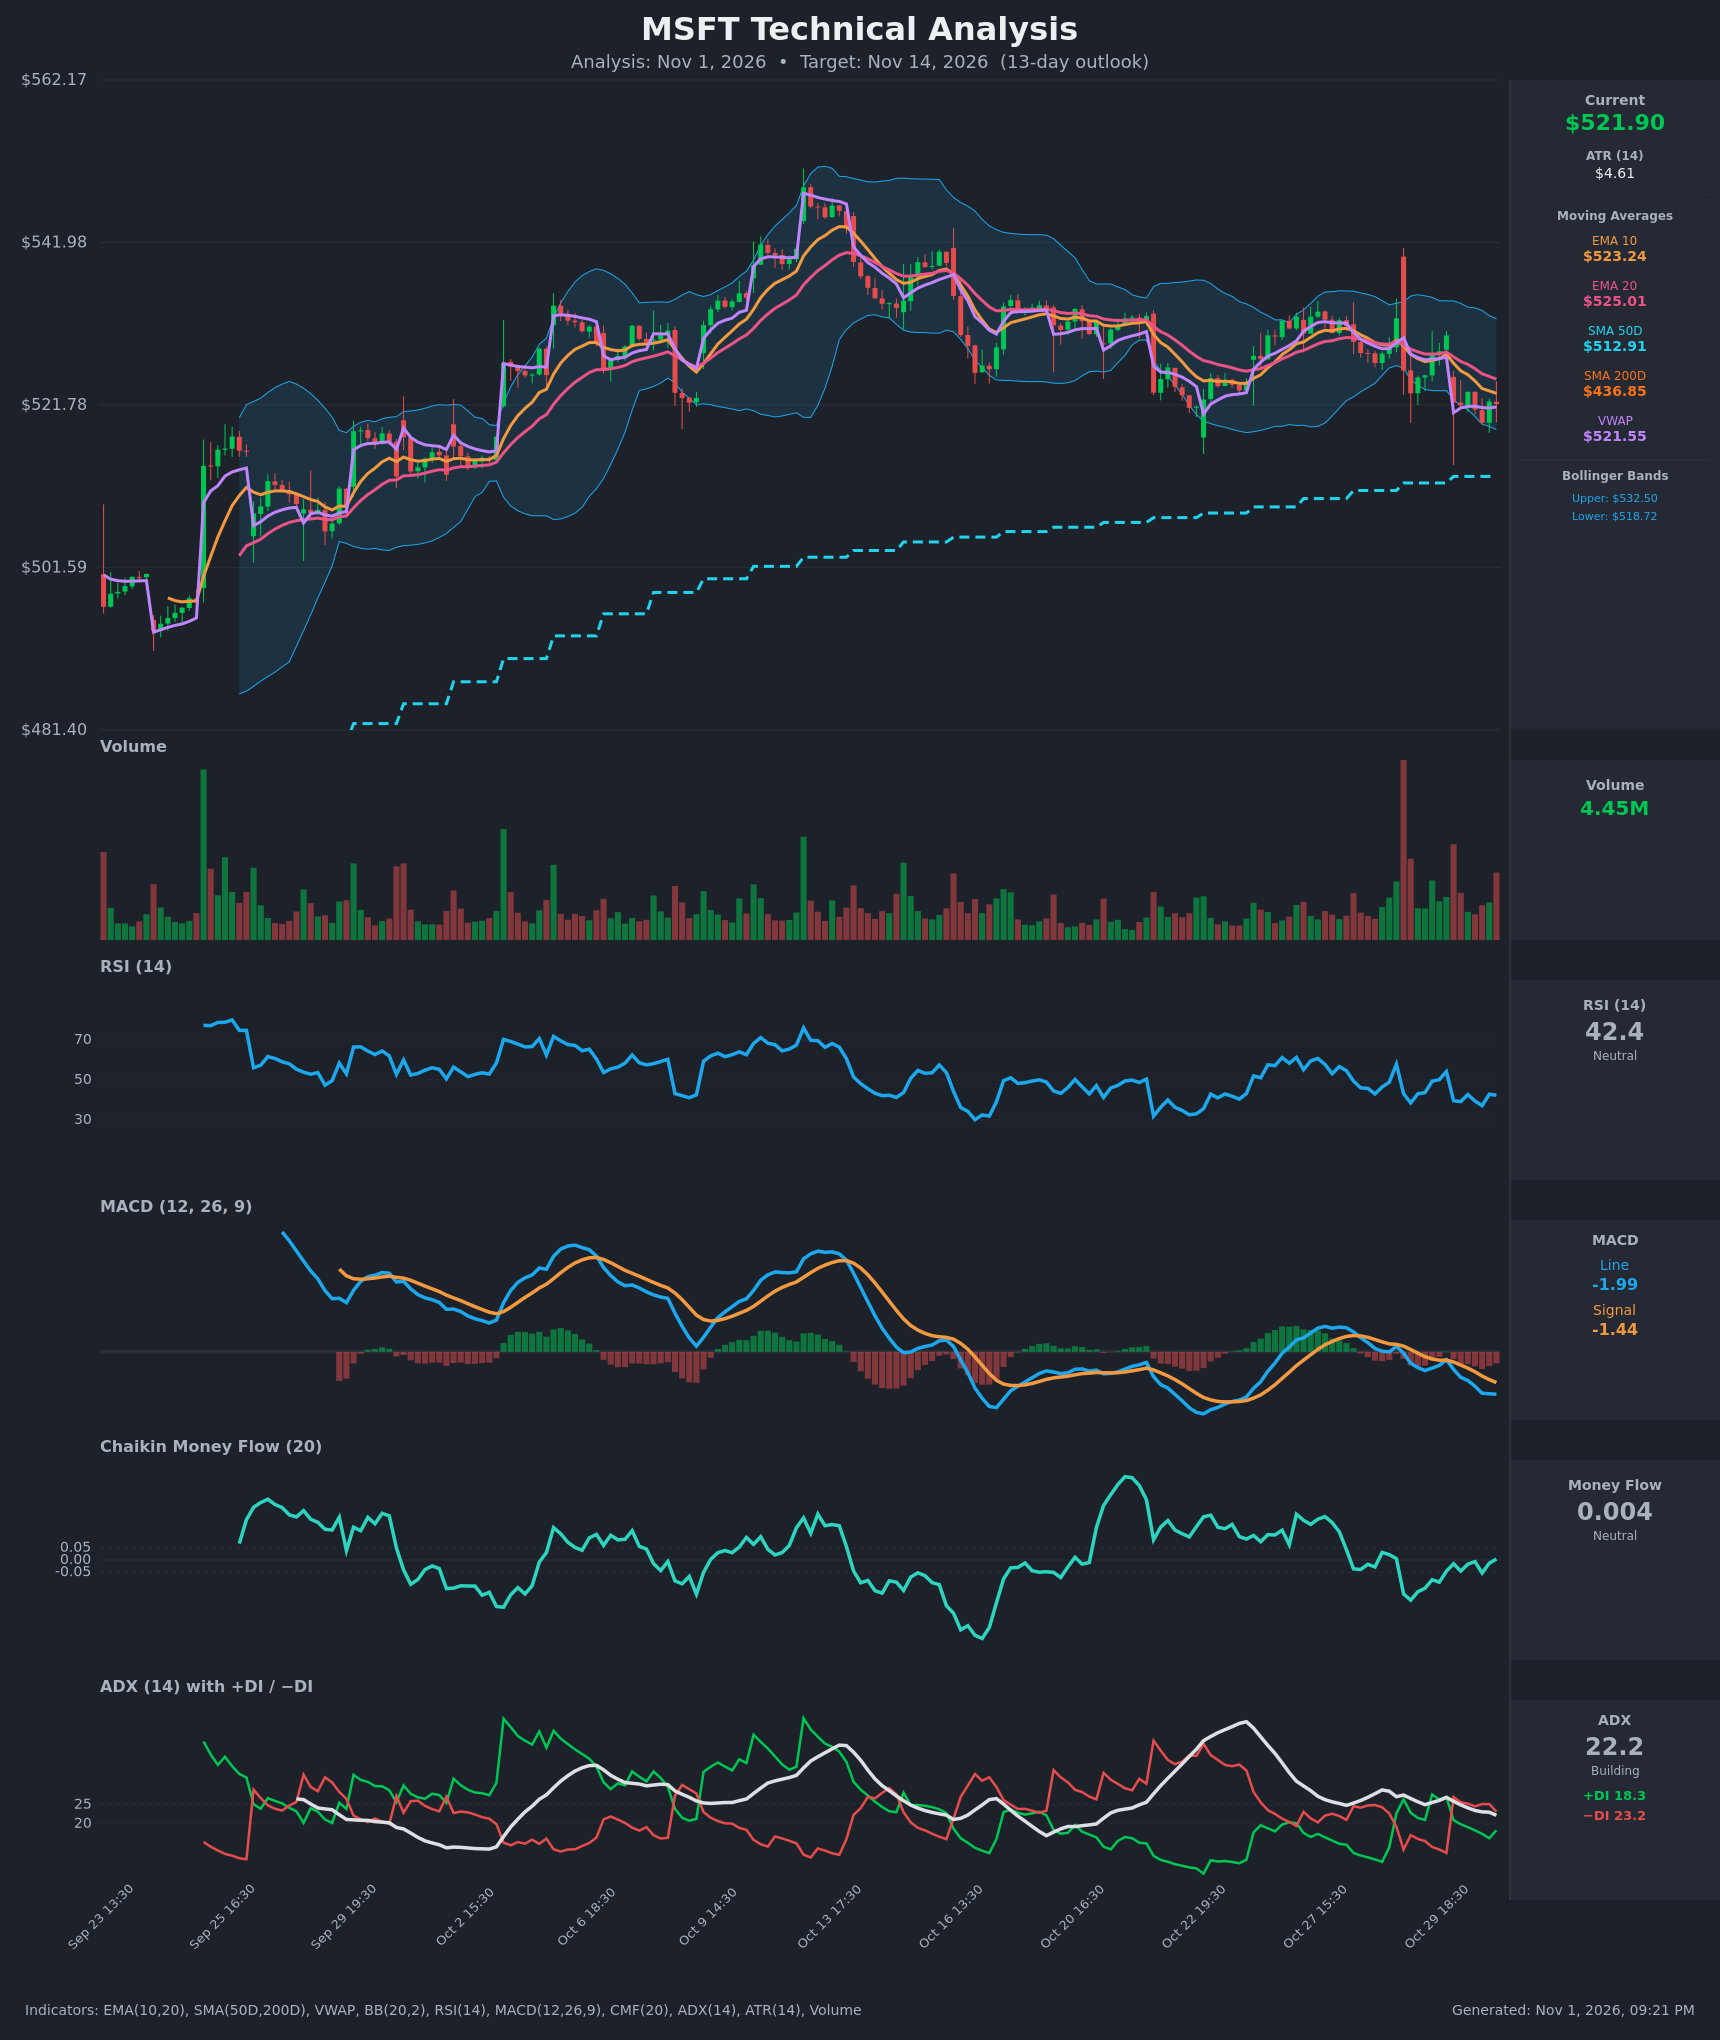
Analysis
TECHNICAL INDICATORS
- RSI (14): 42.4, below the 50 midline and drifting lower from the 54–58 area earlier in the week. It is not oversold (the 30 level was last touched around Oct 16–17), so there is room to fall further. Momentum is soft but not washed out. [Bearish]
- 20 EMA: $525.01, with price at $521.90 below it. EMA10 ($523.24) is below EMA20, a bearish short-term cross. Both EMAs are sloping down and act as overhead resistance. [Bearish]
- MACD: Line -1.99 is below Signal -1.44, and the histogram is negative and widening. The bearish crossover happened on Oct 29. The line is below zero and still falling, so downside momentum is still building. [Bearish]
- Bollinger Bands (20): Upper $532.50, lower $518.72, middle about $525.6. Price sits in the lower third of the bands, about $3 above the lower band. The bands are narrowing after the expansion in mid-October, so volatility is compressing. A lower-band test is likely, and a close below would signal continuation. [Bearish]
- CMF (20): 0.004, between -0.05 and +0.05. It has recovered from -0.16 on Oct 29 but is now flat, so neither buyers nor sellers dominate. [Neutral]
- ADX (14): 22.2 and falling from 27, so the trend is fading in strength but is not yet range-bound. −DI (23.2) is above +DI (18.3), which gives bears the edge. The −DI/+DI gap is narrowing, so selling pressure is modest. [Weak Trend, Bearish lean]
- Volume: 4.45M on the latest bar, near average. There was a large red spike on the Oct 30 gap-down open, which points to distribution on that drop. The bounces since have come on lighter volume. [Mildly Bearish]
DIVERGENCES & TRENDS
- No clear divergence. RSI and MACD both confirm the lower highs in price: the Oct 29 high near $532 was lower than the mid-October peak near $550.
- The trend has rolled over from the October peak into a series of lower highs and lower lows. EMA10 is now below EMA20, MACD has crossed bearish, and −DI has overtaken +DI.
- Price is at VWAP ($521.55) and just above it. The $520–522 area has held as short-term support for several bars.
- Price is well above the SMA50 ($512.91) and far above the SMA200 ($436.85), so the long-term uptrend is intact. The SMA50 is about 1.7% below price and is the next major support. There is no death cross, and the 50/200 gap is wide and bullish.
- The Oct 30 gap down from $530 to $522 has not been filled.
CHART PATTERNS
- The pattern closest to the reference diagram is a loose Bearish Rising Wedge / Double Top. The mid-October peak is followed by a lower high near $532–533 and a drop through the 20 EMA. This suggests a pullback or correction within a larger uptrend.
- Price is also forming a short-term descending channel with lower highs. A break below $518–519 (the lower Bollinger Band and the recent low at $519.58) would point toward the SMA50 near $513 and then the $505–510 area.
- The long-term trend remains bullish, so the pattern reads as a corrective pullback, not a major reversal.
- Measured move: a break of the roughly $518.5 support suggests a target of about $512–513, which coincides with the SMA50.
POTENTIAL SCENARIOS
- Scenario 1: Bearish Pullback to SMA50 — Price fails at the declining EMAs, loses $518.50, and drifts toward the rising SMA50. Trigger: close below $518.50 with MACD still falling. Target: $512–514, with an extension to $508. Invalidation: close above $526 (EMA20 and the middle Bollinger Band). (50% probability)
- Scenario 2: Neutral Range Consolidation — Price chops between $518 and $528 as volatility compresses and ADX falls below 20. Trigger: holds above $518.5 while failing at the 20 EMA. Target: $520–526. Invalidation: close outside the $517–529 range. (25% probability)
- Scenario 3: Bullish Reversal Bounce — Buyers defend VWAP and the lower band, and price reclaims the EMAs. Trigger: close above $526 with a MACD histogram turning up. Target: $532–534 (upper band). Invalidation: close below $518. (25% probability)
PRICE TARGETS
- Target Price: $515.50 (13-day horizon; modestly below current price, about -1.2%, near the SMA50 pull)
- Expected Range: $502.00 to $532.00 (width $30 ≈ 5.7%)
- Key Levels: Support at $512.91 (SMA50; nearer minor support at $518.70, the lower Bollinger Band), Resistance at $525.01 (20 EMA; then $532.50, the upper band)
Self-check: a 13-day horizon calls for roughly 8–12% width. The $30 range is only ~5.7%, which is too narrow, so I am widening it.
- Expected Range (revised): $496.00 to $537.00 (width $41 ≈ 7.9%)
Note: the 13-day horizon sits at the 8% lower bound of the 14–21 day guidance, which is appropriate given the compressing Bollinger Bands and an ATR of only $4.61.
OVERALL BIAS
OVERALL BIAS: BEARISH - Price is below a declining EMA10 and EMA20, MACD has crossed bearish with a widening negative histogram, and −DI is above +DI. The likely path is a pullback toward the SMA50 near $513, while the long-term uptrend above the SMA200 limits deeper downside.
This is educational analysis and not financial advice.