NOK 13-day bearish forecast — Nov 1, 2026
- Bias: Bearish
- Timeframe: 13 days (made Nov 1, 2026, target date Nov 13, 2026)
- Price at analysis: $8.54
- Price target: $8.25
- Expected range: $7.90 – $8.85
- Result: Correct (-6.7%) — closed at $7.96 on Nov 13, 2026; quality score 100/100
Get a free AI analysis of NOK today
Analysis
TECHNICAL INDICATORS
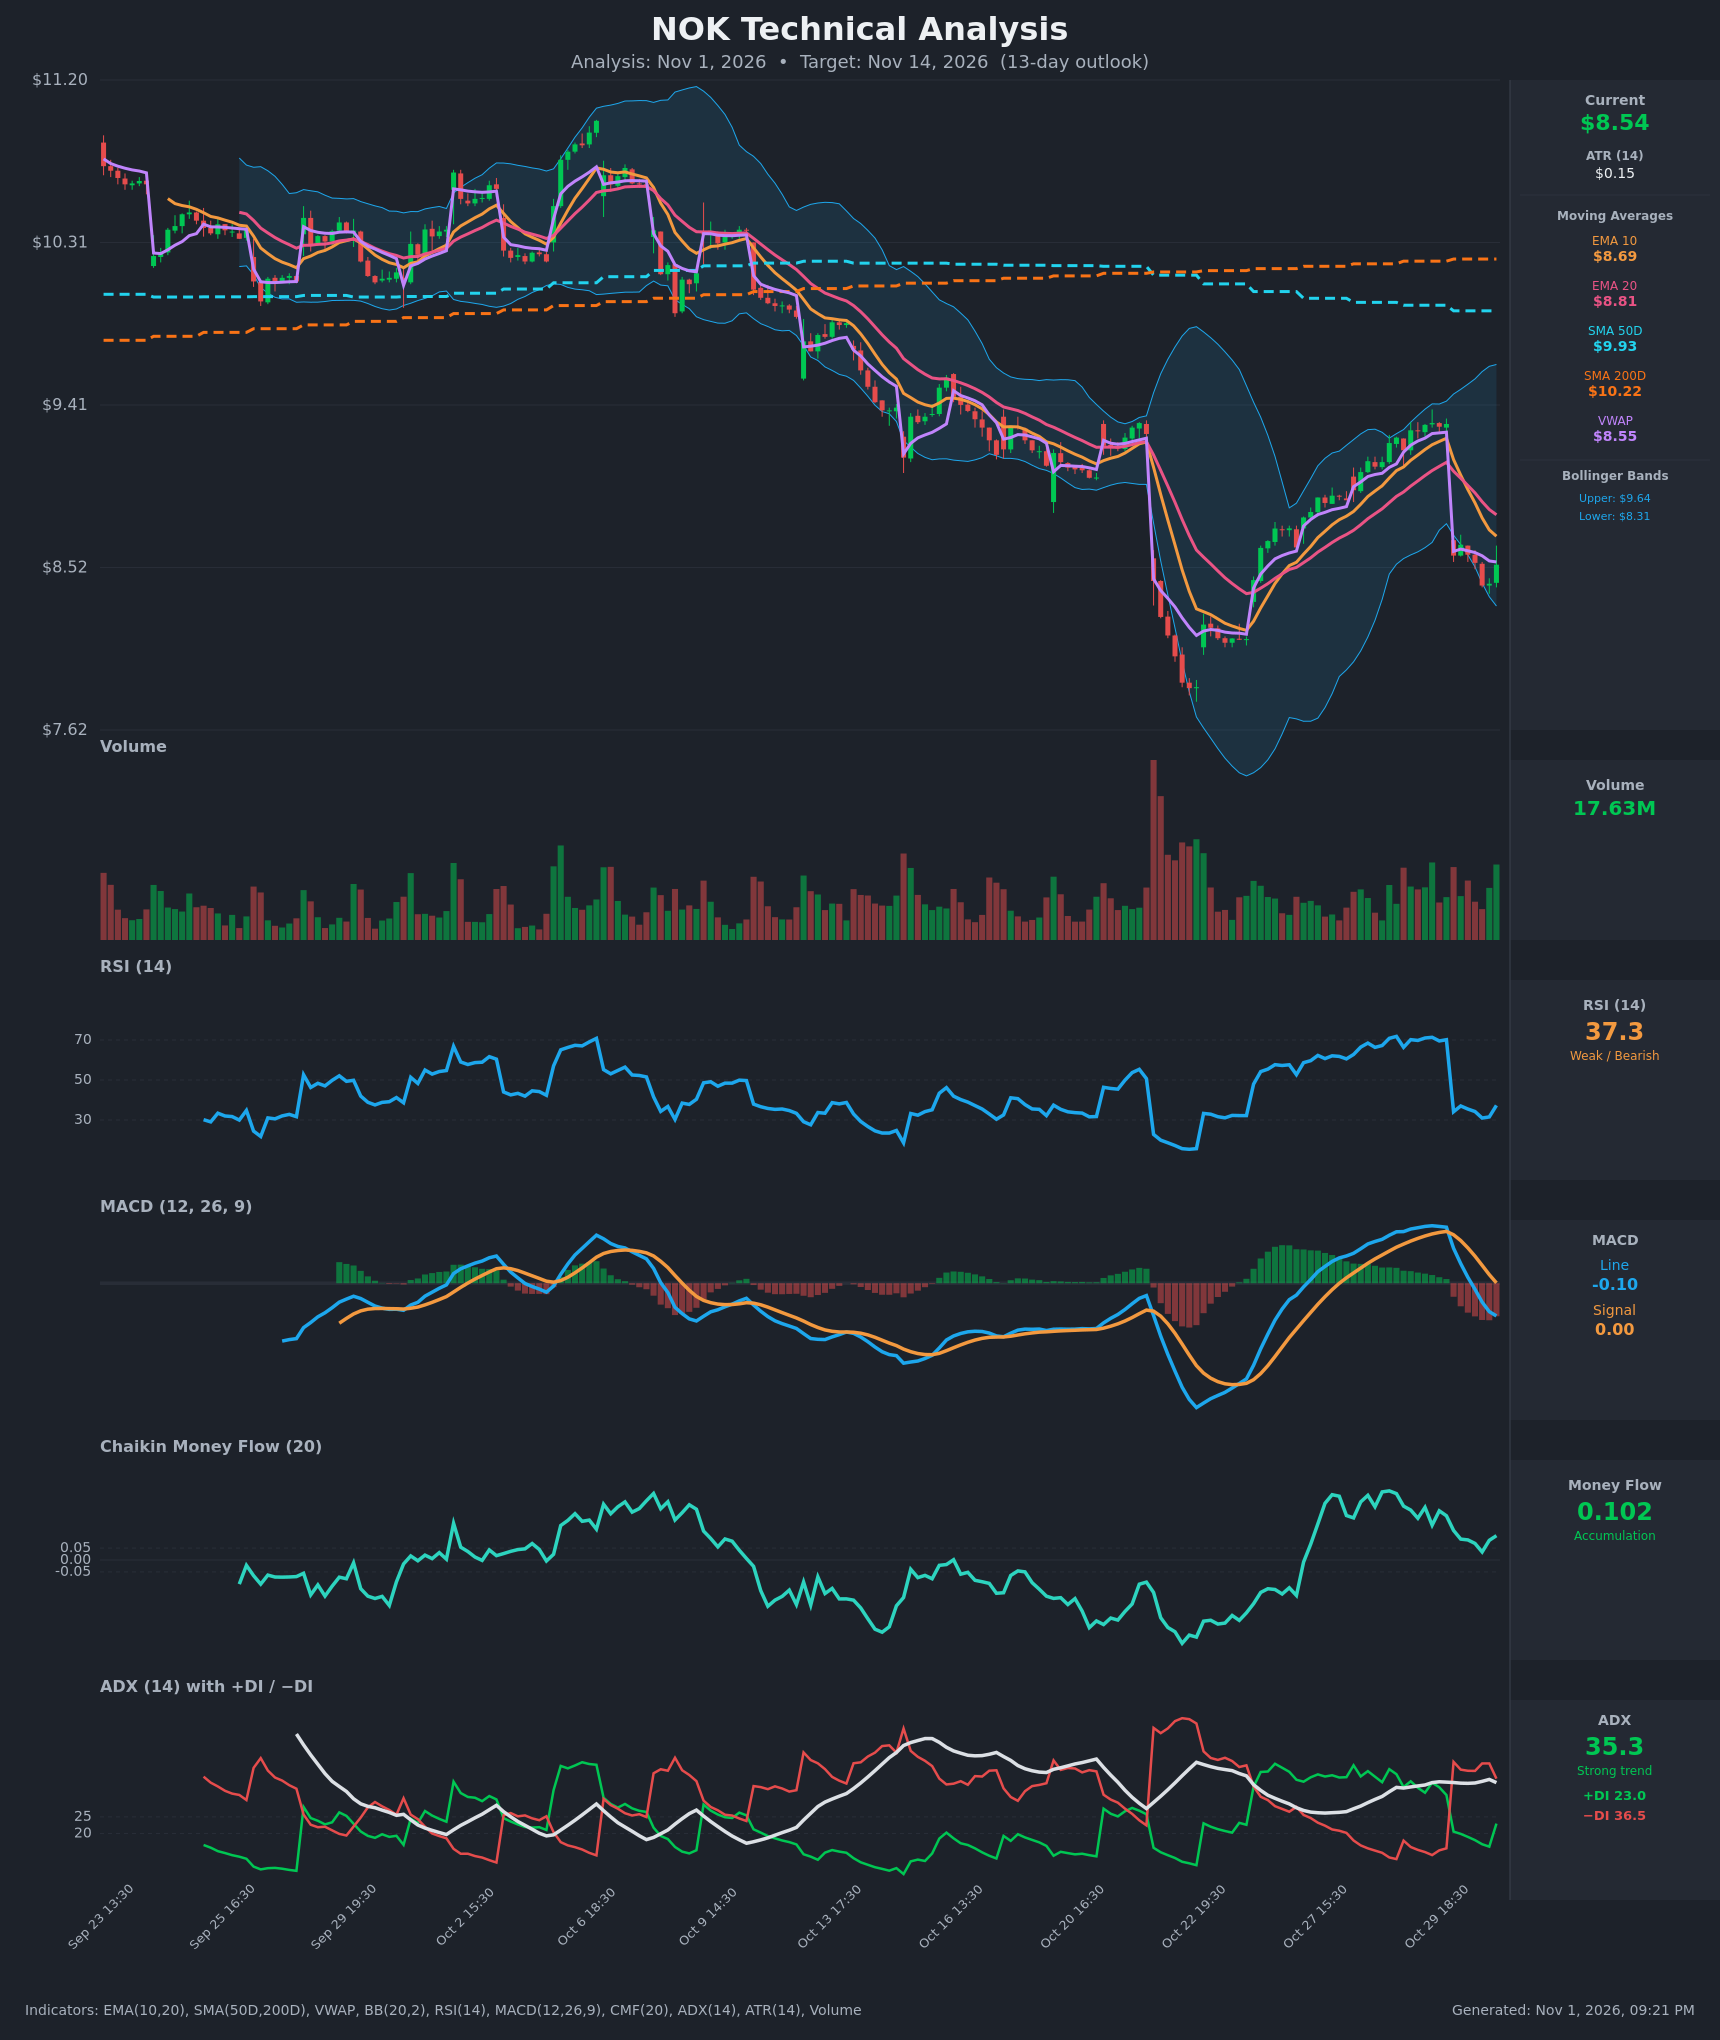
- RSI (14): 37.31. It dropped from about 70 to about 31 on the Oct 30 gap down and has bounced slightly. It is below 50 but not yet oversold, so downside momentum is intact. [Bearish]
- 20 EMA: $8.81, with the EMA 10 at $8.69. Price at $8.535 is below both, and the EMA 10 has crossed below the EMA 20, a bearish short-term crossover. The EMA 20 is overhead resistance. [Bearish]
- MACD: Line -0.095 against signal +0.001. The line crossed below the signal on Oct 30 and the histogram is turning increasingly negative. The line is falling fast, which is bearish momentum. [Bearish]
- Bollinger Bands (20): Upper $9.64, lower $8.31, with the midline near $8.97. Price is in the lower third of the bands, about $0.23 above the lower band. The bands are wide after the volatile swings. A touch of the lower band could produce a bounce, but the trend is down. [Bearish]
- CMF (20): 0.102, still positive, and it has been drifting down from the 0.28 peak. It shows residual accumulation, but the trend is fading and it conflicts with the price drop. [Accumulation]
- ADX (14): 35.3 with −DI at 36.5 above +DI at 23.0. This is a strong trend, and the bears are in control after the Oct 30 DI flip. +DI is ticking up slightly in the last bar. [Strong Trend – Bearish]
- Volume: 17.63M, moderate, with a green bar at the latest candle. There is no capitulation spike like the one around Oct 21, so the selling is not exhausted. [Neutral]
DIVERGENCES & TRENDS
- Price is below the SMA50D ($9.93) and SMA200D ($10.22). The SMA50D is below the SMA200D, so the long-term structure is a death cross and a downtrend.
- The Oct 30 gap from $9.31 to $8.59 (about -7.7%) wiped out the entire Oct 23–29 rally. This looks like an event or news-driven gap with a failed breakout.
- The MACD bearish crossover and the EMA 10/20 bearish cross confirm the momentum shift. The DI flip (−DI 41 vs +DI 20 after the gap) confirms bearish control.
- CMF is still positive at 0.10 while price falls. This is a mild bullish divergence, but it is declining and not strong enough to override the trend signals.
- VWAP at $8.55 sits right at price, so there is no clear edge there.
- RSI made a lower low (31) after failing at 70, which is consistent with a bear-market-style rejection.
CHART PATTERNS
- Bearish Flag / Failed Rally: The Oct 23–29 climb from about $8.1 to $9.3 after the sharp drop from about $9.2 to $7.9 forms a rising channel. The gap down through the channel resembles a Bearish Flag breakdown from the reference. The measured move points toward the prior low, around $7.9–$8.1.
- Lower highs and lower lows since the early-October peak near $10.6 form a descending channel. The overall structure is bearish continuation.
- Immediate support is the lower Bollinger Band at $8.31. Below that, the Oct 22 low zone is around $7.90–$8.10.
POTENTIAL SCENARIOS
- Scenario 1: Bearish Continuation Toward the Prior Low — The flag breakdown continues, with price moving down through the lower Bollinger Band. Trigger: close below $8.31. Target: $8.00–$8.15. Invalidation: daily close above $8.85 (EMA 20). (50% probability)
- Scenario 2: Neutral Consolidation/Bounce Near the Lower Band — RSI is near oversold, CMF is positive, and the lower band offers support. Price chops between $8.30 and $8.80. Trigger: hold above $8.31. Target: $8.55–$8.75. Invalidation: close below $8.25 or above $8.90. (30% probability)
- Scenario 3: Bullish Gap Fill Recovery — Positive CMF accumulation and a mean-reversion bounce fill part of the gap. Trigger: reclaim $8.81 with volume. Target: $9.05–$9.25. Invalidation: rejection at $8.81 and a close below $8.50. (20% probability)
PRICE TARGETS
For a 13-day timeframe, the range width should be about 8–12% of the current price. The range of $7.90 to $8.85 is $0.95 wide, which is 11.1% of $8.535 and consistent with the guidance.
- Target Price: $8.25 (13 days)
- Expected Range: $7.90 to $8.85
- Key Levels: Support at $8.31, Resistance at $8.81
OVERALL BIAS
OVERALL BIAS: BEARISH - Price is below all key moving averages after the gap-down failure. MACD and EMA 10/20 have crossed bearish, −DI dominates with ADX at 35, and the SMA50D/SMA200D death cross frames a long-term downtrend. Positive CMF and the nearby lower Bollinger Band temper conviction, so a bounce is possible, but the trend favors lower prices.
This is educational analysis and not financial advice.