ORCL 13-day bearish forecast — Nov 1, 2026
- Bias: Bearish
- Timeframe: 13 days (made Nov 1, 2026, target date Nov 13, 2026)
- Price at analysis: $130.68
- Price target: $128.00
- Expected range: $122.00 – $134.50
- Result: Correct (-5.4%) — closed at $123.68 on Nov 13, 2026; quality score 100/100
Get a free AI analysis of ORCL today
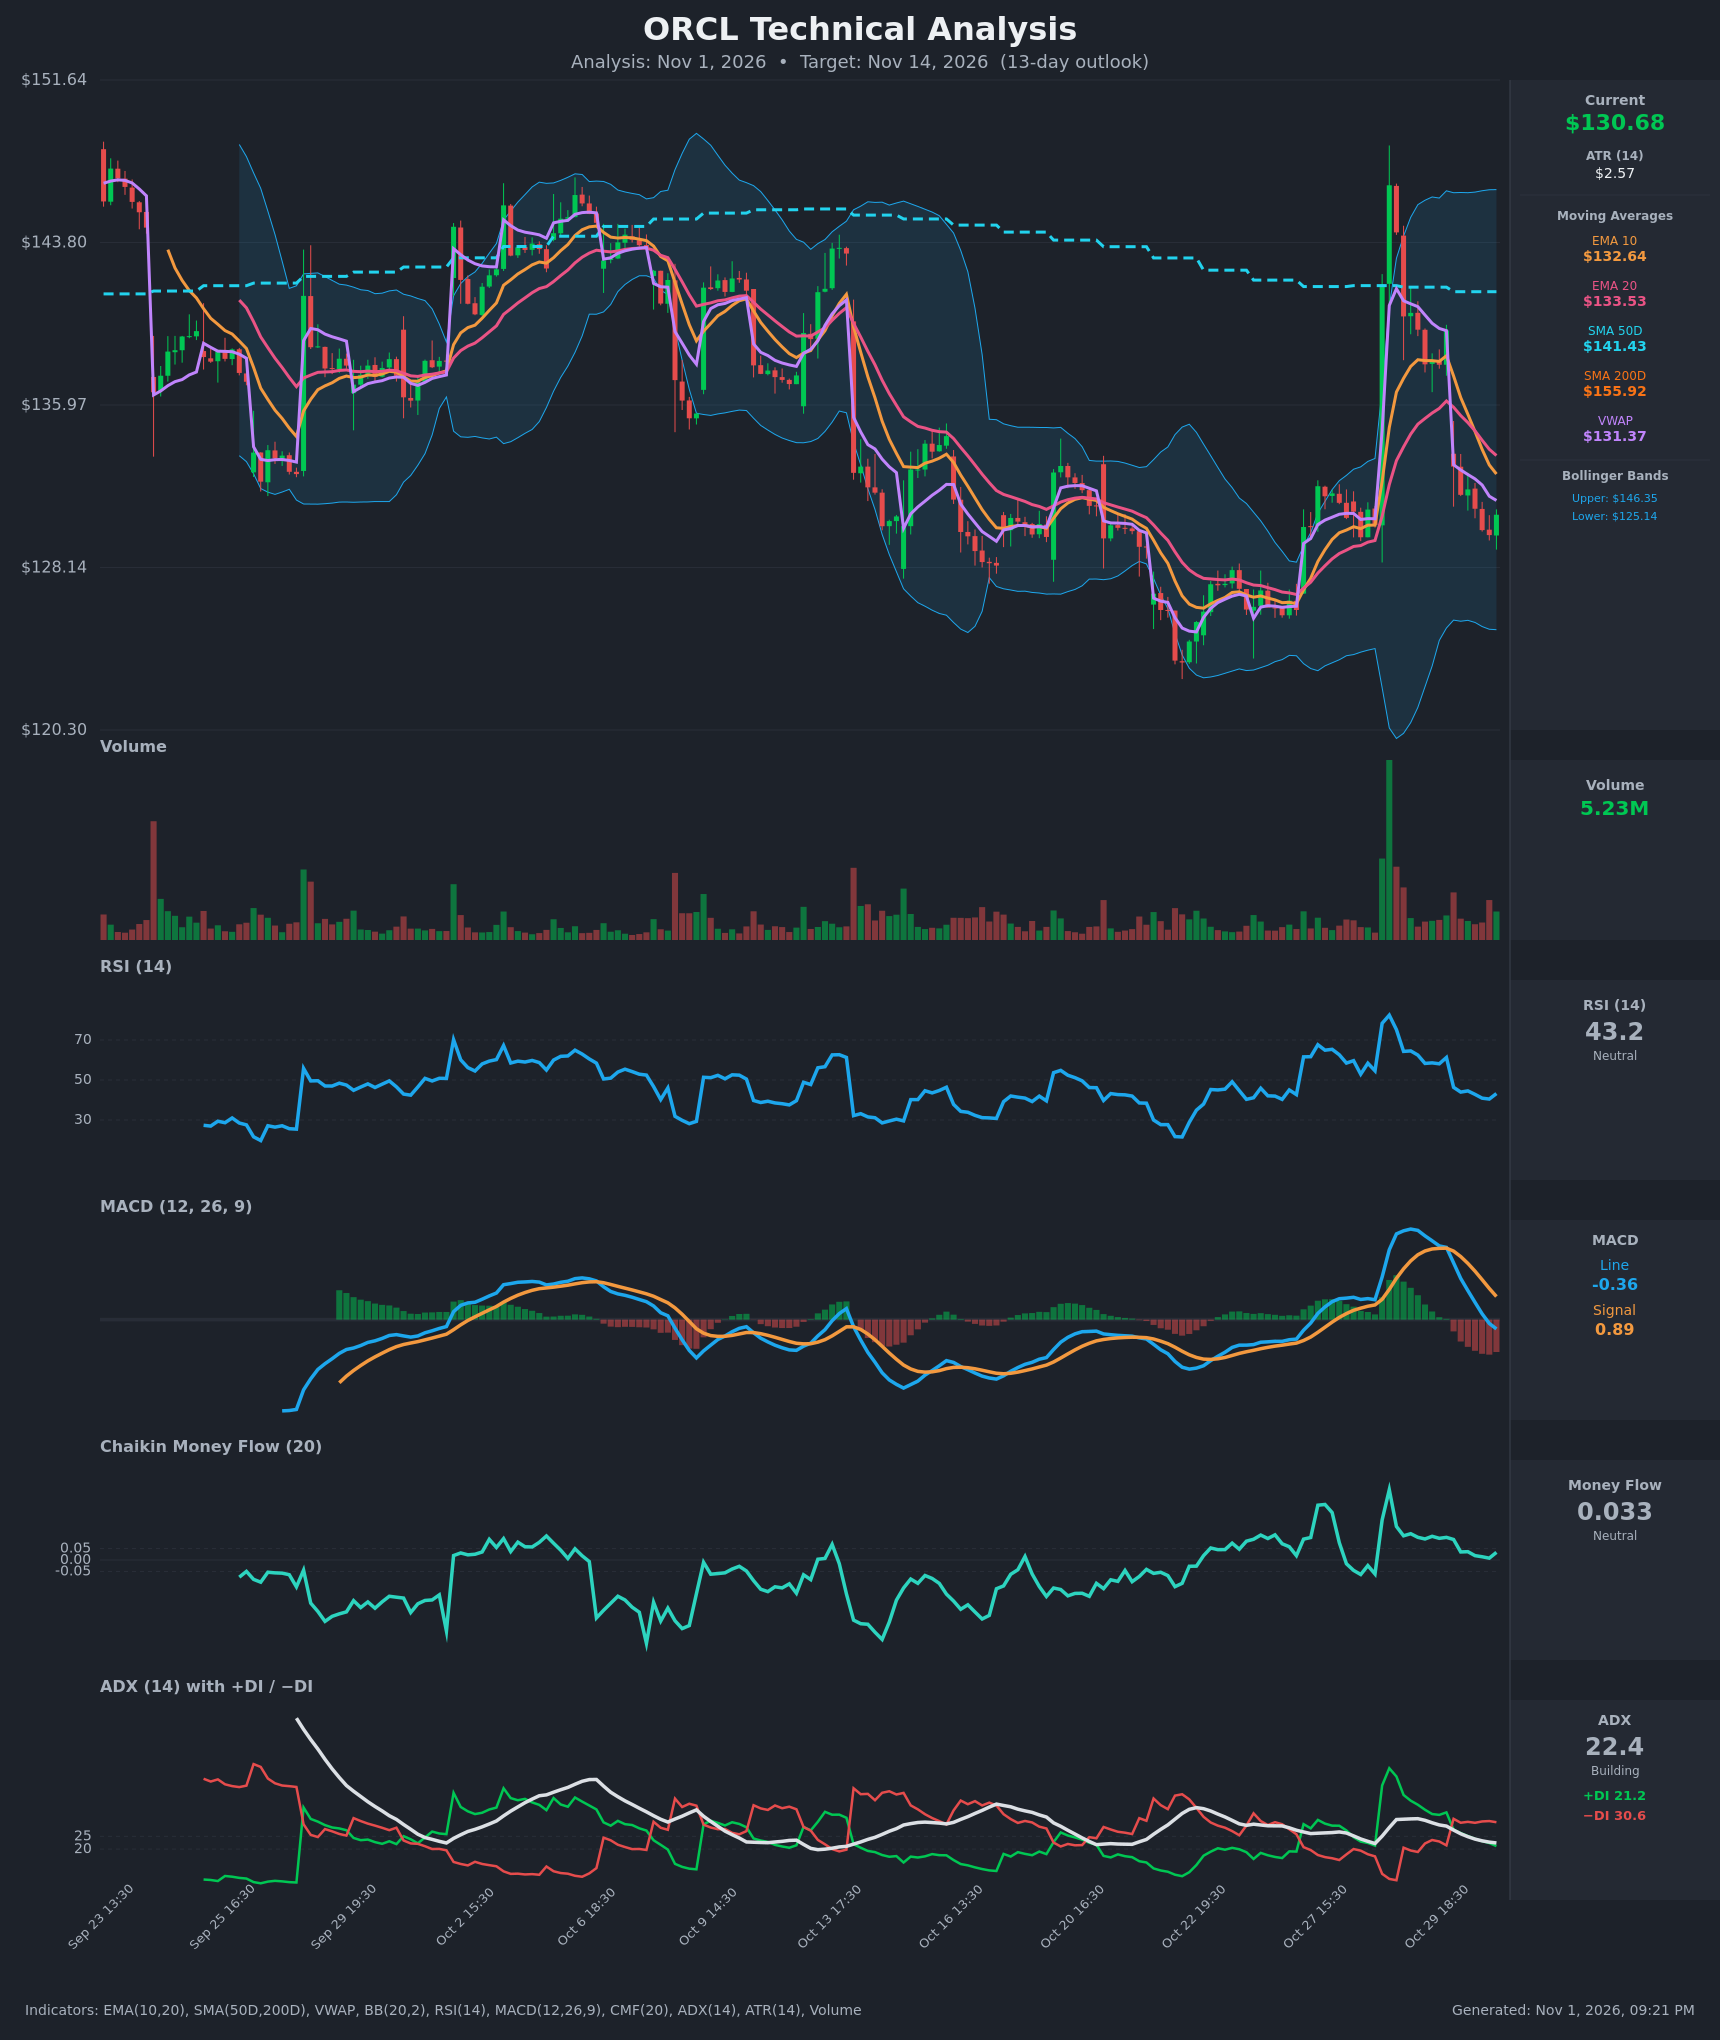
Analysis
TECHNICAL INDICATORS
- RSI (14): 43.21, down from 61 on Oct 29 and 75 on Oct 28. It sits below 50 and above oversold (30), so momentum is fading but not stretched. [Bearish]
- 20 EMA: $133.53. Price at $130.68 is below it, and EMA10 ($132.64) has crossed below EMA20 in the last few bars. The EMA20 is now overhead resistance. [Bearish]
- MACD: Line -0.359 is below Signal 0.894, with a bearish crossover on Oct 30 and a widening negative histogram. The line has just dipped below zero. Momentum is clearly rolling over. [Bearish]
- Bollinger Bands (20): Upper $146.35, Lower $125.14, midline roughly $135.7. The bands are wide after the earnings-type spike. Price sits in the lower half, about 26% of the way from the lower to the upper band, with no squeeze. Room to the lower band is about $5.5. [Bearish]
- CMF (20): 0.033, between -0.05 and +0.05. It has slipped from 0.146 and is still slightly positive, so the earlier accumulation is fading without turning into distribution. [Neutral]
- ADX (14): 22.4 and falling from 32, so the trend is weak to moderate. −DI (30.6) is above +DI (21.2), and the DI cross happened on Oct 30. Bears have the edge, but the trend lacks strength. [Weak Trend, Bearish direction]
- Volume: 5.23M, average to slightly above average. The surge-day volume was far higher, and the recent decline came on modest volume. There is no capitulation and no strong conviction either way. [Neutral/Mildly Bearish]
Moving averages: price is below SMA50 ($141.43) and SMA200 ($155.92), which is a long-term downtrend. SMA50 is well below SMA200, so a death cross is already in place. Price is also below VWAP ($131.37), which is a mild sign of selling pressure.
DIVERGENCES & TRENDS
- No clear divergence. RSI and MACD are both making lower highs after the spike to about $144, which is consistent with price.
- The gap-up spike to about $144 was fully retraced, which marks a failed breakout (a bull trap). That is a bearish signal.
- Bearish crossovers are stacking up: EMA10 below EMA20, MACD below Signal, and −DI above +DI. The 10-bar slide from $139.56 to $130.68 shows momentum rolling over.
- ADX is falling from 32 to 22, so the spike-driven trend is exhausting. Price may drift or chop before the next directional move.
- Support is the prior range low near $125-$127 (October lows around $123-$125), which also lines up with the lower Bollinger Band at $125.14.
CHART PATTERNS
- Bearish Rising Wedge / Double Top (loose): the October rally to about $144 failed at the SMA50 and the upper band, then reversed sharply. It resembles a failed breakout, a double-top-like structure with the early October high around $144-$145.
- The reference diagram shows no clean fit. The closest is a bearish continuation of the larger downtrend below the falling SMA200. The measured move points back to the $125-$127 range base.
- The range low near $123-$127 is a base that could form a bullish double bottom if retested and held. That is the alternative scenario.
POTENTIAL SCENARIOS
- Scenario 1: Bearish Retest of Range Lows — Price stays below the EMA20/VWAP and retests the $125-$127 base as the bearish MACD and DI signals play out. Trigger: breaks below $129.50 and the recent low of about $129.70. Target: $126.00, with an extension to $125. Invalidation: close above $134 (EMA20 and the Oct 30 gap area). (50% probability)
- Scenario 2: Neutral Consolidation — Price chops between $127 and $134 as ADX stays near 20 and CMF stays neutral. Trigger: holds $128.50 and fails at $133.50. Target: $130-$132. Invalidation: close outside $127-$134. (28% probability)
- Scenario 3: Bullish Rebound — RSI at 43 bounces, MACD flattens, and price reclaims the EMA20 and fills toward the SMA50. Trigger: close above $134. Target: $138-$141. Invalidation: close back below $129. (22% probability)
PRICE TARGETS
- Target Price: $128.00 (13-day)
- Expected Range: $122.00 to $134.50. The width is $12.50, or about 9.6% of the current price, which fits the 14-21 day guidance (~8-12%) and is appropriate for 13 days. ATR of $2.57 × √13 ≈ $9.3 supports a range of this size.
- Key Levels: Support at $125.14, Resistance at $133.53
OVERALL BIAS
OVERALL BIAS: BEARISH - MACD and DI crossovers are bearish, EMA10 has crossed below EMA20, and price is below VWAP, the 50-day and the 200-day averages after a failed spike. The $125-$127 range base is the likely target, though weak ADX and neutral CMF limit conviction.
This is educational analysis and not financial advice.