NBIS 13-day bearish forecast — Nov 1, 2026
- Bias: Bearish
- Timeframe: 13 days (made Nov 1, 2026, target date Nov 13, 2026)
- Price at analysis: $154.10
- Price target: $149.50
- Expected range: $142.50 – $157.00
- Result: Correct (-26.8%) — closed at $112.80 on Nov 13, 2026; quality score 50/100
Get a free AI analysis of NBIS today
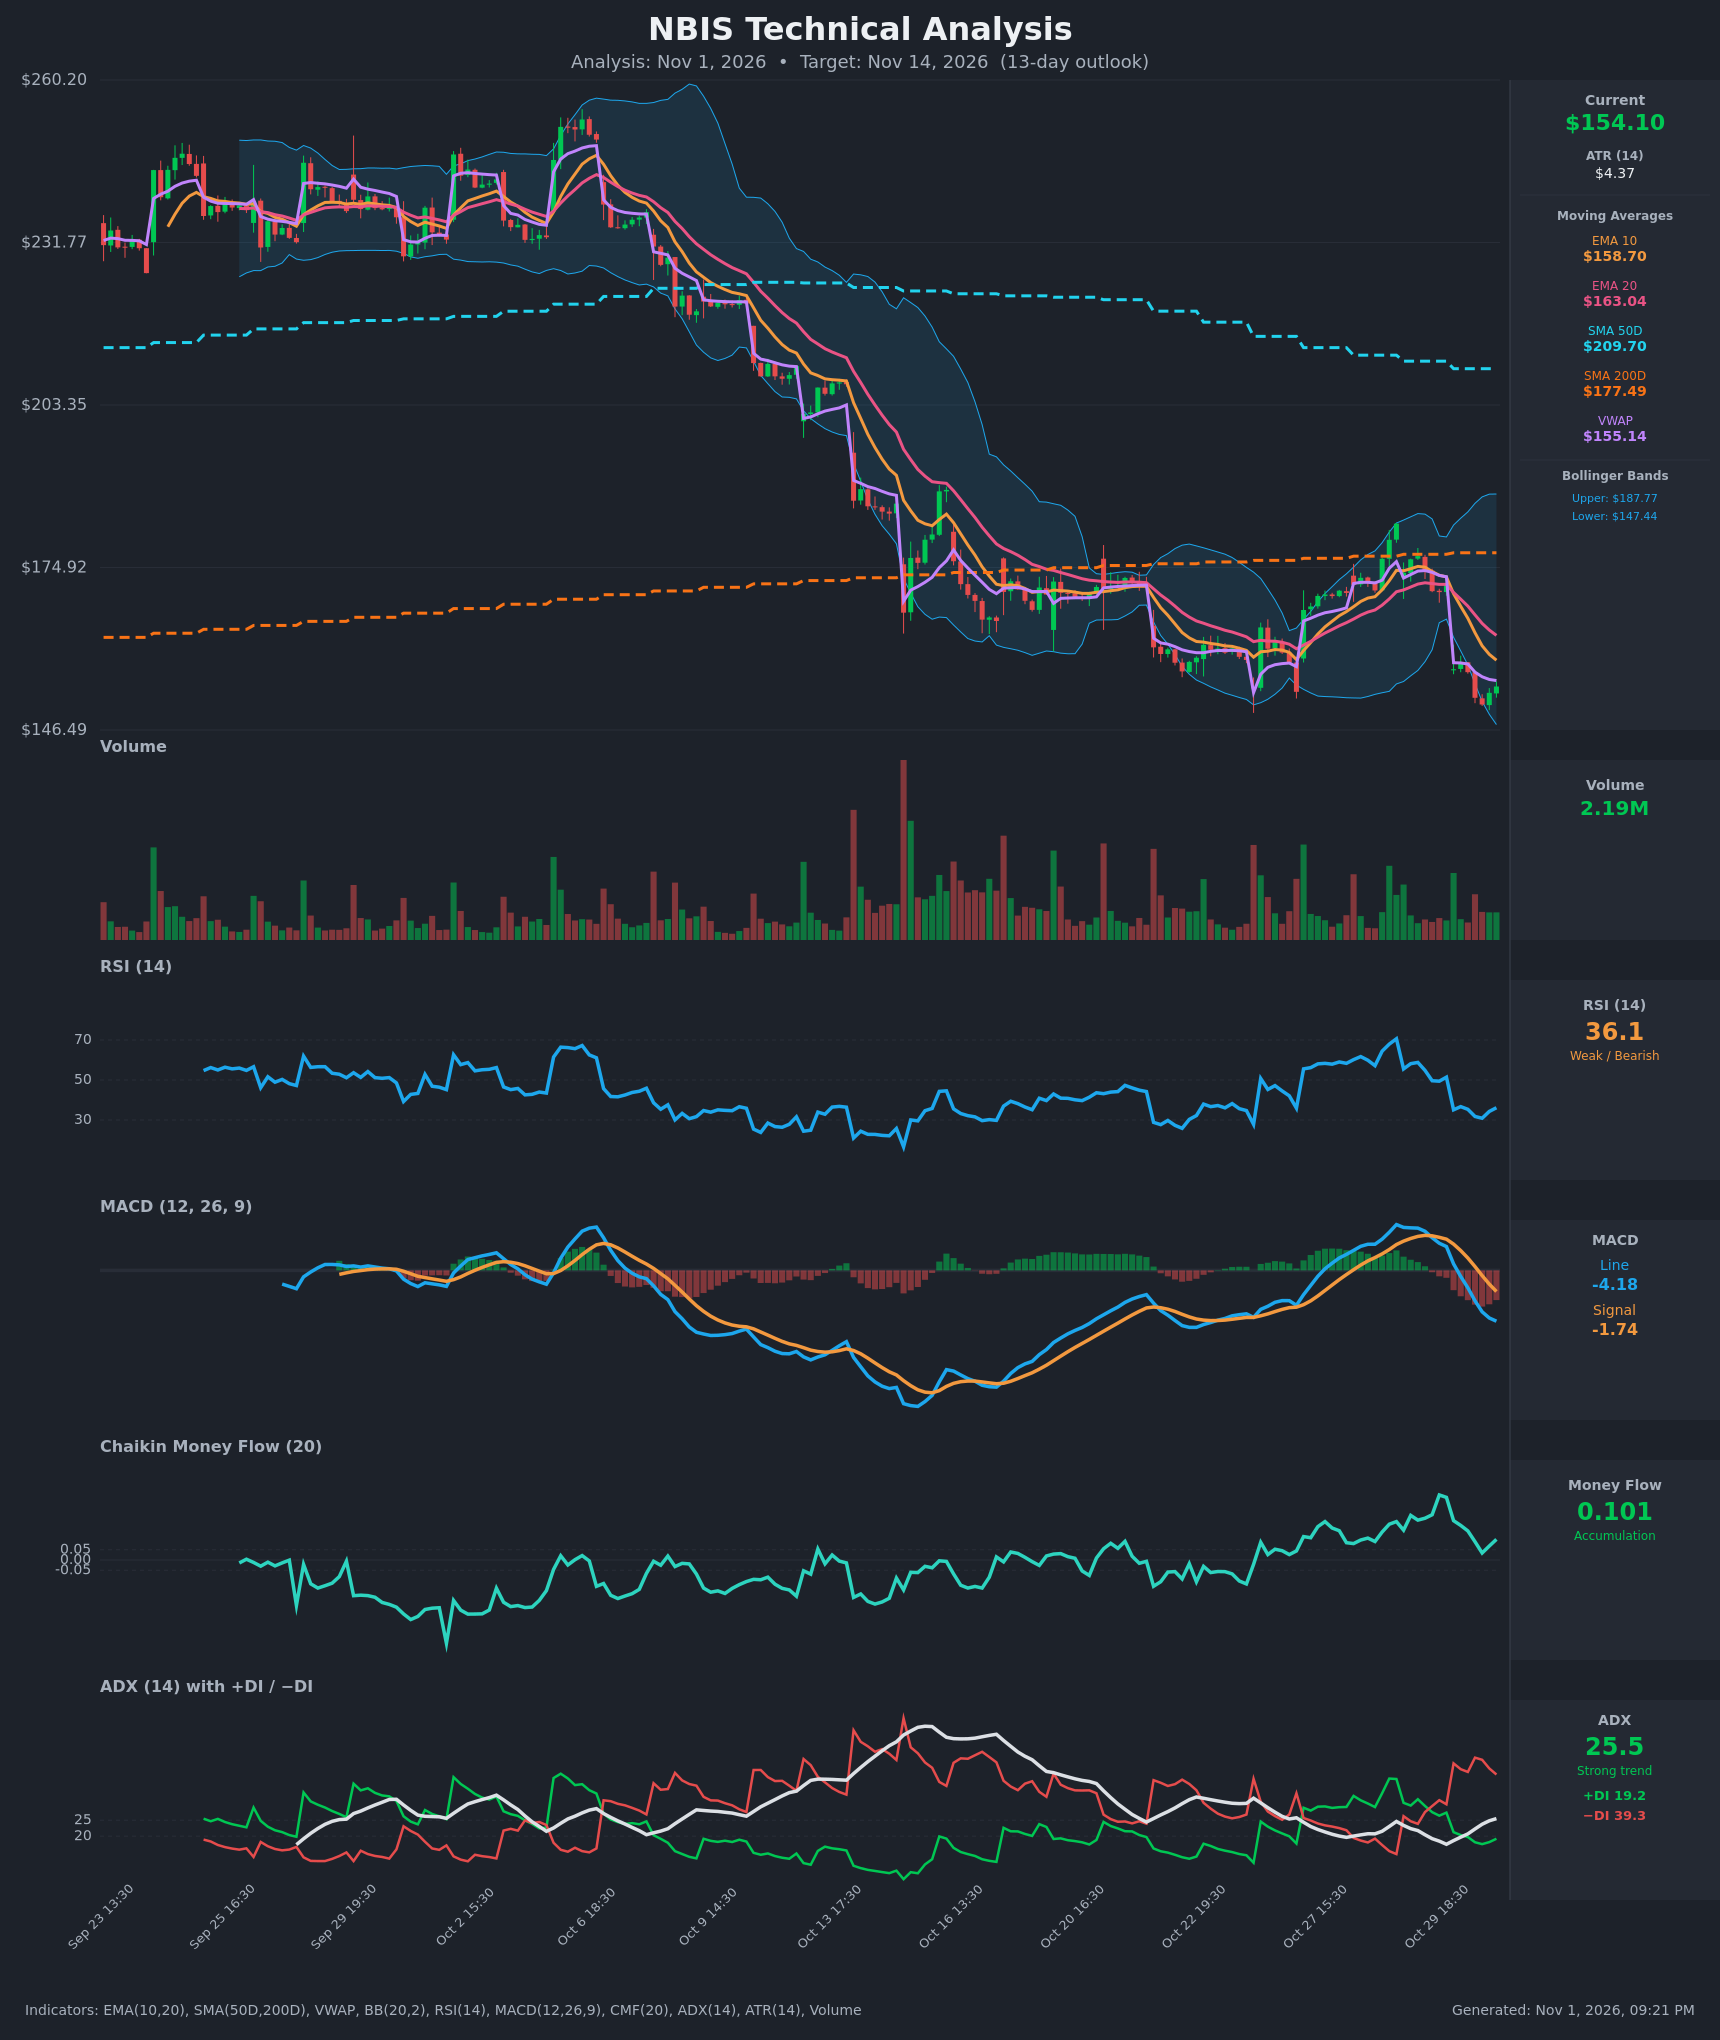
Analysis
TECHNICAL INDICATORS
- RSI (14): 36.13, down from 70.6 on Oct 28 and 51 on Oct 29. It is approaching oversold (<30) but not there yet, so there is room for further downside. Momentum is falling, though the last few bars show a slight uptick from 30.9. [Bearish]
- 20 EMA: $163.04, with the 10 EMA at $158.70. Price at $154.10 is below both, and both are sloping down. The EMA10 crossed below the EMA20 around Oct 30 (EMA10 $170.33 vs EMA20 $170.55), which confirms short-term bearish momentum. The 20 EMA is overhead resistance. [Bearish]
- MACD: Line at -4.18, signal at -1.74. The line crossed below the signal on Oct 30 and has dropped below zero. The histogram is negative and widening, so downside momentum is still accelerating. [Bearish]
- Bollinger Bands (20): Upper $187.77, lower $147.44. Price is in the lowest part of the band, about 16% of the way up from the lower band, with the lower band only about 4.3% below. The bands are wide, reflecting high volatility. Price is hugging the lower band, which is a sign of trend strength, but it also raises the odds of a mean-reversion bounce toward the midline (~$167.6). [Bearish]
- CMF (20): +0.101, above the +0.05 threshold. It has stayed positive throughout the recent selloff, which points to buying on dips and acts as a mild counter-signal. It has faded from 0.317 to 0.034 and has only partly recovered. [Accumulation]
- ADX (14): 25.5 and rising from 17.5, so a strong trend is emerging. −DI at 39.3 is far above +DI at 19.2, so bears are firmly in control. [Strong Trend – Bearish]
- Volume: 2.19M, modest relative to the heavy-volume selloff bars earlier in October. The last bars show no capitulation spike, so there is no clear exhaustion signal. Price is below VWAP's $155.14 by about $1, so sellers hold a slight intraday edge. [Neutral to Bearish]
DIVERGENCES & TRENDS
- CMF vs. price: CMF is positive (0.10) while price made new lows. This is a mild bullish divergence that suggests some accumulation. It is not confirmed by RSI or MACD, so it carries less weight.
- RSI vs. price: RSI at 36 is above the early-October lows near 25-30, but price is now below those lows, so there is no clear divergence. RSI is simply following price down.
- Trend structure: Price is making lower highs ($255 → $182) and lower lows. It is below the SMA200D ($177.49) and the SMA50D ($209.70), and the SMA50D is rolling over toward the SMA200D, so a death cross is a medium-term risk.
- Crossovers: EMA10/EMA20 bearish cross (Oct 30), MACD bearish cross (Oct 30), and −DI above +DI since Oct 30. Price also lost the SMA200D, a key long-term support, on Oct 30.
- Gap down: The Oct 29→30 gap from ~$172 to ~$157 is a bearish breakaway and left VWAP overhead.
CHART PATTERNS
- Bearish Rising Wedge / Bear Flag (from reference): The Oct 22–29 bounce from ~$152 to ~$182 formed a rising channel that broke down sharply on Oct 30. That is a classic bearish resolution, with price retracing the entire move. The measured target is the wedge's origin near $148–152, and price is already there.
- Bearish continuation structure: The broader staircase decline of lower highs and lower lows, with failed bounces at the falling EMAs, is a bearish trend continuation. A break below ~$147 could extend toward $135–140.
- Potential support test: The $147–150 zone has acted as a floor several times (Oct 22 and Oct 27 lows). Repeated tests weaken support, and failure here would be a bearish break.
POTENTIAL SCENARIOS
- Scenario 1: Bearish Trend Continuation — The strong ADX and −DI dominance, with price below all moving averages, favor a break of the $147 support zone. Rallies stall at the EMA10/EMA20. Trigger: close below $147.44 (lower BB) on rising volume. Target: $140–$145. Invalidation: daily close above $163 (EMA20). (50% probability)
- Scenario 2: Bullish Oversold Bounce — Positive CMF, price at the lower Bollinger Band and RSI near 36 allow a relief rally toward the moving averages and the BB midline. Trigger: reclaim of VWAP/EMA10 near $155–159 with RSI turning up. Target: $163–$168. Invalidation: loss of $147. (30% probability)
- Scenario 3: Neutral Consolidation — Price chops between $147 and $160 as the selloff pauses and ADX flattens. Trigger: MACD histogram flattening and low-volume range trading. Target: $150–$158. Invalidation: close outside $146–$163. (20% probability)
PRICE TARGETS
- Target Price: $149.50 (13-day)
- Expected Range: $142.50 to $157.00 (width $14.50 ≈ 9.4% of current price, consistent with a ~13-day horizon and ATR of $4.37)
- Key Levels: Support at $147.44, Resistance at $158.70
OVERALL BIAS
OVERALL BIAS: BEARISH - The strong, rising ADX with −DI far above +DI, bearish MACD and EMA crossovers, and price below the SMA50D/SMA200D and all EMAs outweigh the positive CMF and the near-lower-band bounce potential. Conviction is modest because of the oversold-bounce risk.
This is educational analysis and not financial advice.