NFLX 13-day bullish forecast — Nov 1, 2026
- Bias: Bullish
- Timeframe: 13 days (made Nov 1, 2026, target date Nov 13, 2026)
- Price at analysis: $62.09
- Price target: $63.30
- Expected range: $59.80 – $65.00
- Result: Correct (-0.2%) — closed at $61.95 on Nov 13, 2026; quality score 100/100
Get a free AI analysis of NFLX today
Analysis
TECHNICAL INDICATORS
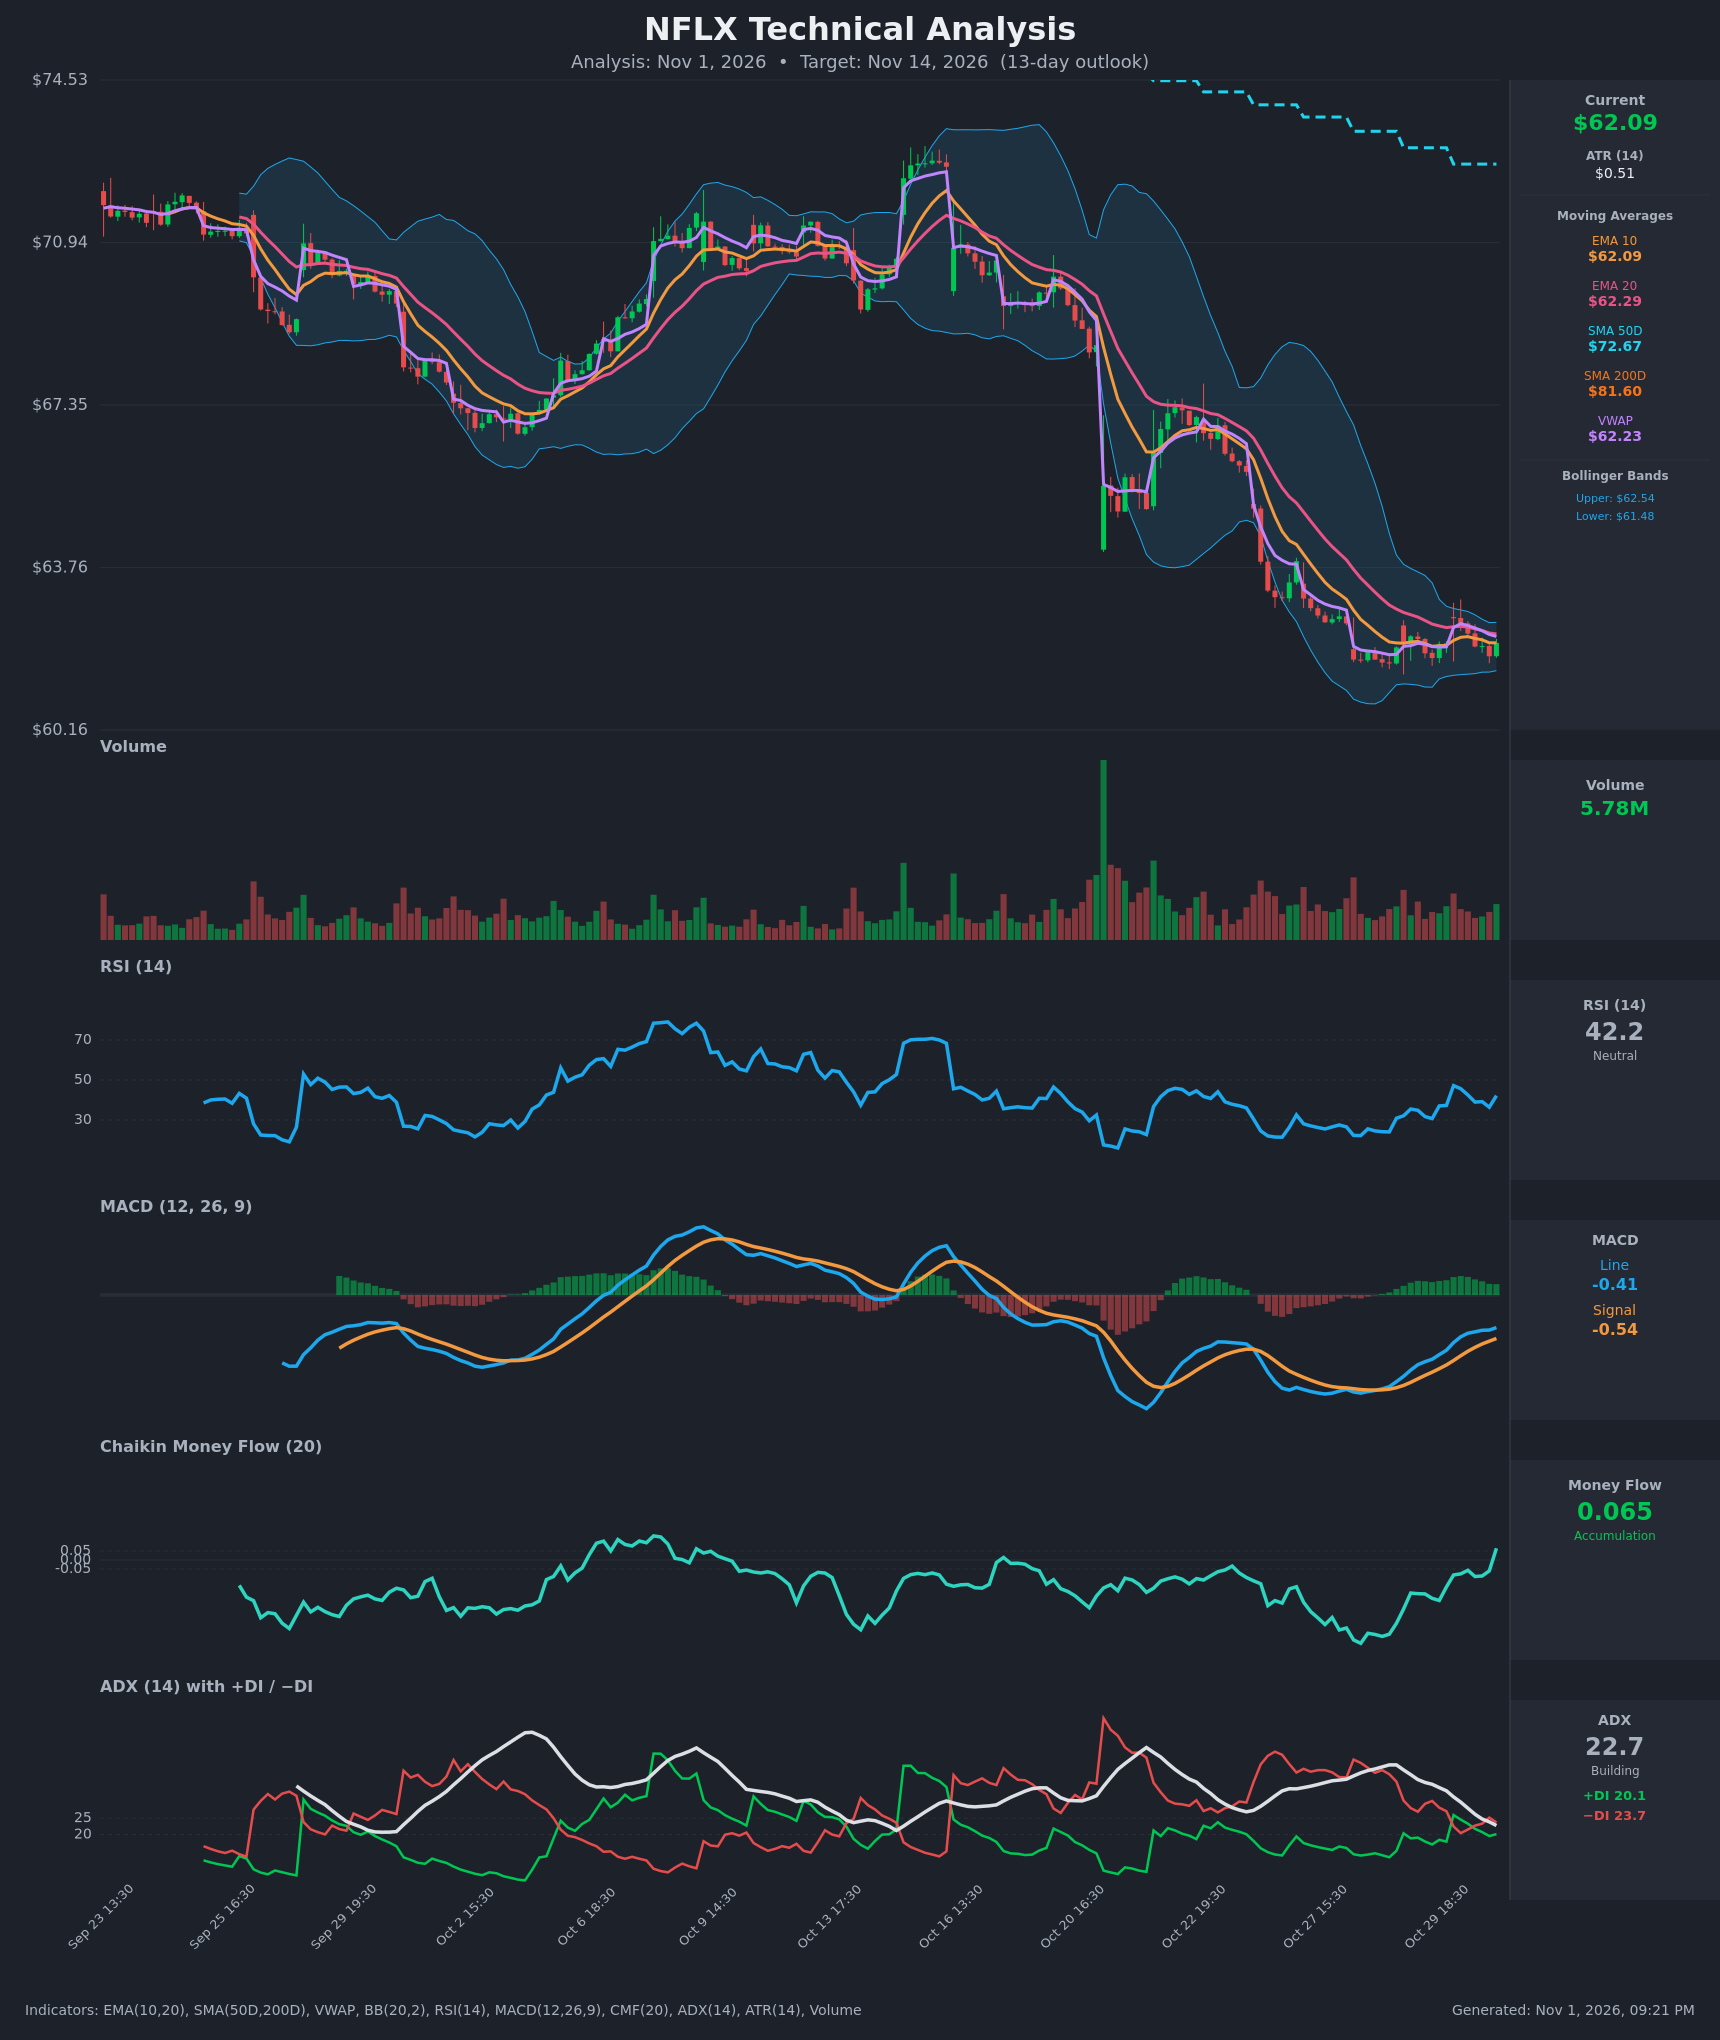
- RSI (14): 42.18, up from the ~31 oversold area on Oct 28-29. It has made a higher low (~36 on Oct 30 vs ~31 earlier) and is still below 50, so it is recovering but has not regained neutral territory. [Neutral]
- 20 EMA: $62.29, just above price ($62.09). EMA10 ($62.09) is flat on price and below EMA20, so the short-term cross is still bearish. The EMA20 has been acting as overhead resistance throughout the decline. [Bearish]
- MACD: Line -0.407 is above Signal -0.542, a histogram of about +0.135. The line crossed above the signal around Oct 29-30 and the histogram is positive and expanding. Both lines are still below zero, so this is an early recovery, not a confirmed trend change. [Bullish]
- Bollinger Bands (20): Upper $62.54, lower $61.48, a very tight squeeze after the earlier wide expansion. Price sits mid-band at $62.09 and has stopped riding the lower band. A volatility expansion is likely, and the direction is not yet decided. [Neutral]
- CMF (20): 0.065, a jump from -0.06 to above the +0.05 threshold on the last bar. This is the first accumulation reading after a long stretch of negative flow, but it is a single bar and needs confirmation. [Accumulation]
- ADX (14): 22.7 and falling from 41 as the selloff matured. -DI 23.7 is only marginally above +DI 20.1, after +DI briefly led on Oct 30. The trend is weakening, bears are only barely in control, and the market is drifting toward range conditions. [Weak Trend, slightly bearish]
- Volume: 5.78M, average and unremarkable. There was no capitulation spike at the lows. The biggest volume came on the earlier gap-down, and recent volume is fading, which fits consolidation. [Neutral]
DIVERGENCES & TRENDS
- Bullish momentum divergence (mild): Price made new lows near $61.4-61.8 while RSI held a higher low and MACD rose from -1.08 to -0.41. Downside momentum is fading.
- MACD: The bullish line/signal crossover occurred, and the histogram has turned positive.
- ADX: It has dropped from 41 to 22.7 as -DI faded from 36 to 24, so the selloff is losing strength.
- Long-term trend: Price is far below the SMA50D ($72.67) and SMA200D ($81.60). The SMA50D is below the SMA200D (a death cross already in force), and both are declining. This is a dominant bearish backdrop.
- Moving averages: Price has not reclaimed the EMA20 or the VWAP ($62.23), so buyers have not yet shown control.
- CMF: The turn to positive is a first hint of accumulation, and it is unconfirmed.
CHART PATTERNS
- Bearish Pennant / Flag (continuation): The sharp drop from ~$67 to ~$62 followed by a tight, narrowing consolidation matches this pattern. A break below ~$61.40 would imply a measured move of roughly $4-5 lower, toward $57-58.
- Bullish Falling Wedge (reversal): Lower highs and lower lows are compressing within the narrowing Bollinger Bands, with momentum divergence. A break above ~$62.65 (the EMA20 and upper band) would target a retracement toward $64-65.
- Interpretation: The consolidation is tight with fading ADX and improving momentum, which slightly favors a relief bounce. The larger downtrend limits upside to a retracement, not a reversal.
POTENTIAL SCENARIOS
- Scenario 1: Bullish Relief Bounce — The MACD cross, the CMF turn to accumulation, and the RSI higher low lead to a breakout from the squeeze, with price reclaiming the EMA20 and VWAP. Trigger: a close above $62.65 with volume above 6M. Target: $63.30 to $64.80, where the prior breakdown zone and the falling EMAs sit. Invalidation: a close below $61.40. (45% probability)
- Scenario 2: Bearish Downtrend Continuation — The consolidation is a pennant or flag inside a dominant downtrend, with price below all the major MAs and -DI still above +DI. Trigger: a close below the lower band at $61.40. Target: $59.80 to $60.50. Invalidation: a close above $62.90, reclaiming the EMA20 and upper band. (40% probability)
- Scenario 3: Neutral Range Chop — Price oscillates between $61.40 and $62.65 as ADX drops below 20. Trigger: failure to break either band edge. Target: about $62.00. Invalidation: a decisive break outside the range. (15% probability)
PRICE TARGETS
- Target Price: $63.30 (13-day)
- Expected Range: $59.80 to $65.00. Width is $5.20, about 8.4% of the current price, which fits the 13-day scaling.
- Key Levels: Support at $61.40, Resistance at $62.65
OVERALL BIAS
OVERALL BIAS: BULLISH - Momentum is turning up (bullish MACD cross, RSI higher low, CMF moving into accumulation) while ADX fades and the Bollinger squeeze is poised to resolve. Confidence is modest because the long-term trend is bearish and the bounce would likely stall near $64-65.
This is educational analysis and not financial advice.