NVDA 13-day bullish forecast — Nov 1, 2026
- Bias: Bullish
- Timeframe: 13 days (made Nov 1, 2026, target date Nov 13, 2026)
- Price at analysis: $204.81
- Price target: $208.50
- Expected range: $198.00 – $216.00
- Result: Incorrect (-21.3%) — closed at $161.18 on Nov 13, 2026; quality score 0/100
Get a free AI analysis of NVDA today
Analysis
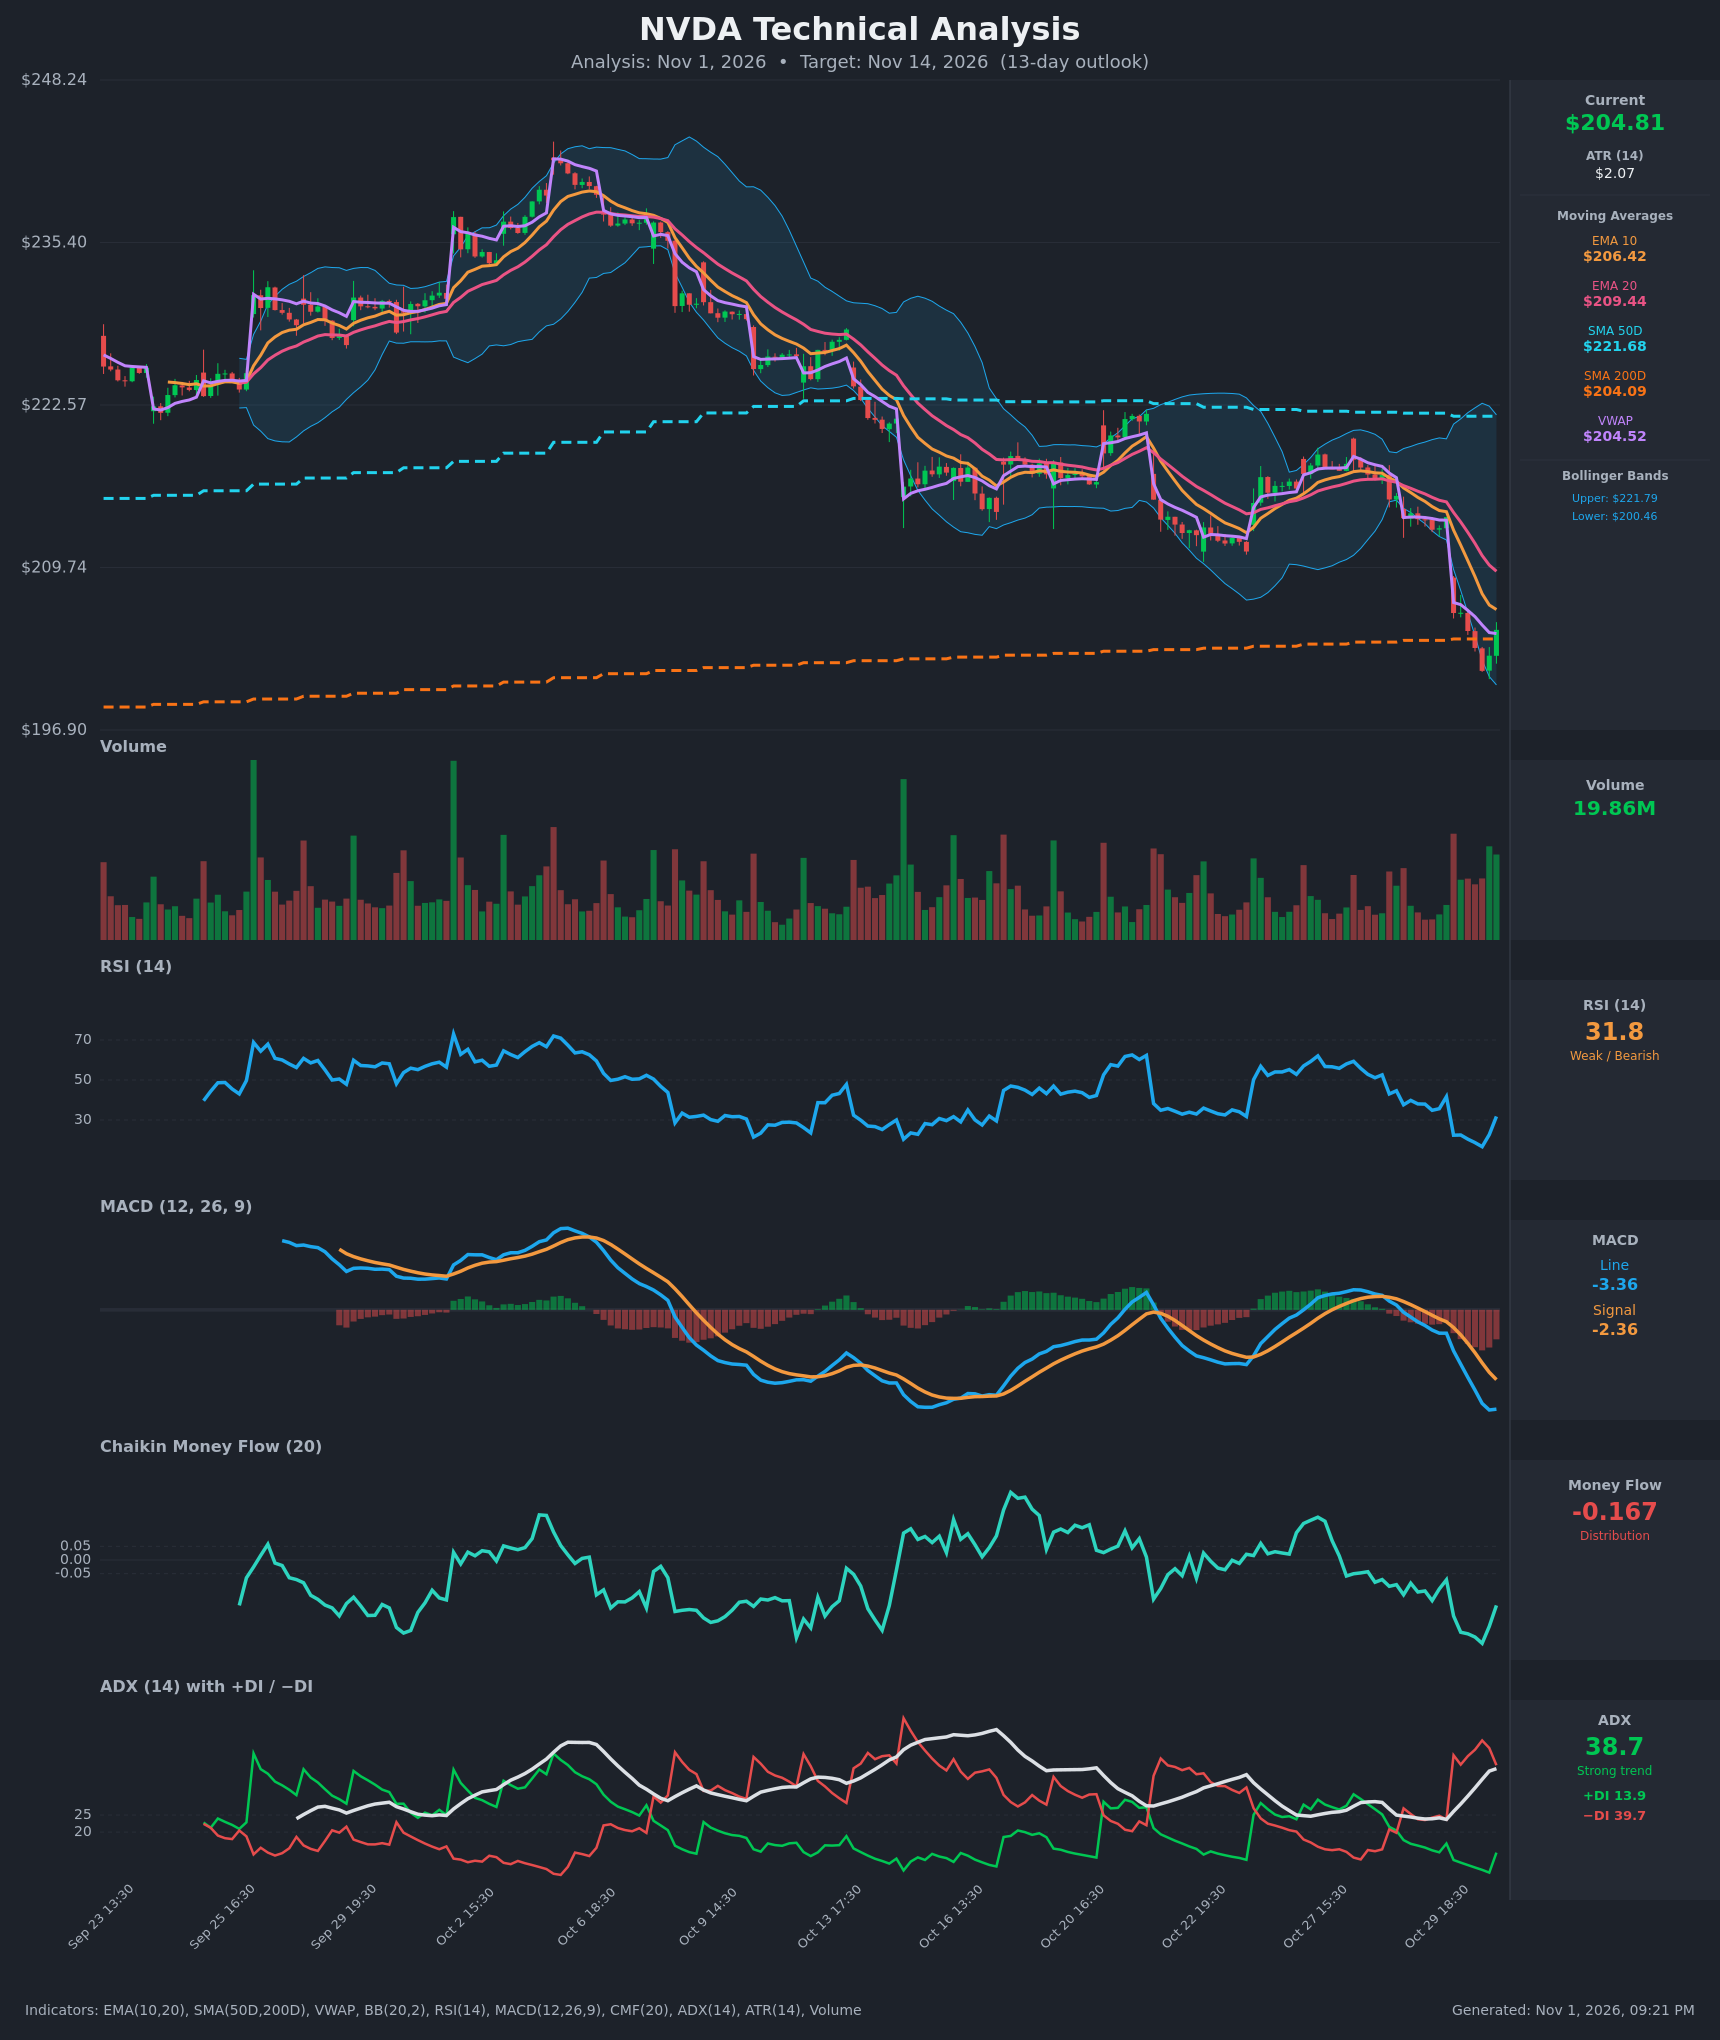
TECHNICAL INDICATORS
- RSI (14): 31.77. It bottomed at 16.6 on Oct 30 and has bounced about 15 points in two bars. That was an extreme oversold washout, and the reading is still below 40, so momentum is only just turning up. [Neutral]
- 20 EMA: $209.44, with the EMA10 at $206.42 below it. Price ($204.81) is under both, so they act as overhead resistance. The EMA10 is below the EMA20, a bearish stack, and the gap between them is widening. [Bearish]
- MACD: Line -3.36 against signal -2.36, so the line is below the signal and the histogram is negative at about -1.0. The line flattened in the last bar (-3.391 to -3.363), which hints the downside momentum is peaking. There is no bullish crossover yet. [Bearish]
- Bollinger Bands (20): Upper $221.79, lower $200.46. Price tagged and pierced the lower band during the Oct 30 sell-off and has moved back inside. The bands are wide after the volatility expansion. Moves back inside the lower band often lead to a mean-reversion bounce toward the midline (~$211). [Neutral]
- CMF (20): -0.167, well below -0.05 and in distribution. It ticked up from -0.306 but remains clearly negative, so sellers still dominate. [Distribution]
- ADX (14): 38.7 and rising, a strong trend. −DI (39.7) is far above +DI (13.9), so bears are firmly in control. The recent +DI uptick (8.1 to 13.9) is small. [Strong Trend – Bearish]
- Volume: 19.86M, average to slightly above average. The last two bars were green on decent volume, which suggests some dip buying near $201–203, but it is not yet a decisive capitulation or reversal signal. [Mild Stabilization]
Other levels:
- SMA200: $204.09, which price is sitting on. It is a key long-term support.
- SMA50: $221.68, well above price.
- VWAP: $204.52, which price is just above.
DIVERGENCES & TRENDS
- There is no clean bullish RSI divergence. RSI made an extreme low (16.6) with the price low ($201.57), and the latest bounce is a momentum recovery rather than a divergence.
- MACD and ADX confirm the downtrend. ADX has risen from about 24 to 38.7 as −DI surged from about 24 to 47, then eased to 39.7.
- Price fell below the EMA10 and EMA20 and below the lower Bollinger Band. The Oct 30 gap down from about $213.7 to $206 leaves a gap-fill zone as resistance.
- Price has held the SMA200 (~$204) and the VWAP, with the last close at $204.81. This is the first sign of stabilization after a one-day, roughly 3.5% flush.
- The EMA10 and EMA20 had a bearish alignment before this drop. SMA50 is well above SMA200, so there is no death cross, but the gap is narrowing.
CHART PATTERNS
- Descending channel / bearish flag-like structure: Since the Oct 6 peak (~$241), price has made lower highs and lower lows. This resembles a Bearish Flag/Descending Triangle continuation, with a breakdown to the $201 area. Textbook targets would sit near $195–$198 if $200 fails.
- Possible oversold bounce within the downtrend: The extreme RSI (16.6) and the lower-band pierce back to the SMA200 support suggest a relief bounce. This is not a confirmed Bullish Falling Wedge or Double Bottom, so a reversal pattern is not established.
- Resistance for any bounce is the gap-fill/EMA20 zone at $209–$214. A close above ~$214 would be needed to negate the lower-high structure.
POTENTIAL SCENARIOS
- Scenario 1: Bullish Oversold Relief Bounce — Price holds the SMA200/lower-band zone and mean-reverts toward the EMA20 and the gap, as extreme oversold RSI unwinds and MACD flattens. Trigger: close above the EMA10 ($206.42) and then the EMA20 ($209.44). Target: $208.50 to $212 (gap fill/Bollinger midline). Invalidation: close below $200. (45% probability)
- Scenario 2: Bearish Trend Continuation — The downtrend, with ADX near 39, −DI dominance and CMF in distribution, resumes, and the bounce fails at the EMA10/EMA20. Price breaks the SMA200 and the Oct 30 low. Trigger: close below $200.46. Target: $196–$198. Invalidation: close above $210. (40% probability)
- Scenario 3: Neutral Basing Range — Price chops between $200 and $209 as the oversold and trend signals offset. Trigger: failure to clear $209 or break $200. Target: $203–$207. Invalidation: close outside $200–$210. (15% probability)
PRICE TARGETS
Timeframe: 13 days (Nov 14, 2026). The ATR is $2.07, so a typical 13-day move is roughly ±$7.5 (about 3.6%). Given the elevated volatility, the range is widened accordingly.
- Target Price: $208.50
- Expected Range: $198.00 to $216.00 (width $18.00 = 8.8% of current price, consistent with the 8–12% guidance for ~13 days)
- Key Levels: Support at $200.46, Resistance at $209.44
OVERALL BIAS
OVERALL BIAS: BULLISH - Price is sitting on the SMA200 (~$204) after an extreme oversold washout (RSI low 16.6) and a lower Bollinger Band pierce, and the MACD is flattening. A modest relief bounce toward the EMA20 and the gap zone is slightly more likely than a continued breakdown. Conviction is low, however, because the trend indicators (ADX 38.7 with −DI dominant, CMF −0.167, price below the EMAs) remain bearish. A close below $200 would flip the view.
This is educational analysis and not financial advice.