PLTR 13-day bearish forecast — Nov 1, 2026
- Bias: Bearish
- Timeframe: 13 days (made Nov 1, 2026, target date Nov 13, 2026)
- Price at analysis: $184.10
- Price target: $180.50
- Expected range: $173.50 – $188.50
- Result: Correct (-10.2%) — closed at $165.30 on Nov 13, 2026; quality score 60/100
Get a free AI analysis of PLTR today
Analysis
TECHNICAL INDICATORS
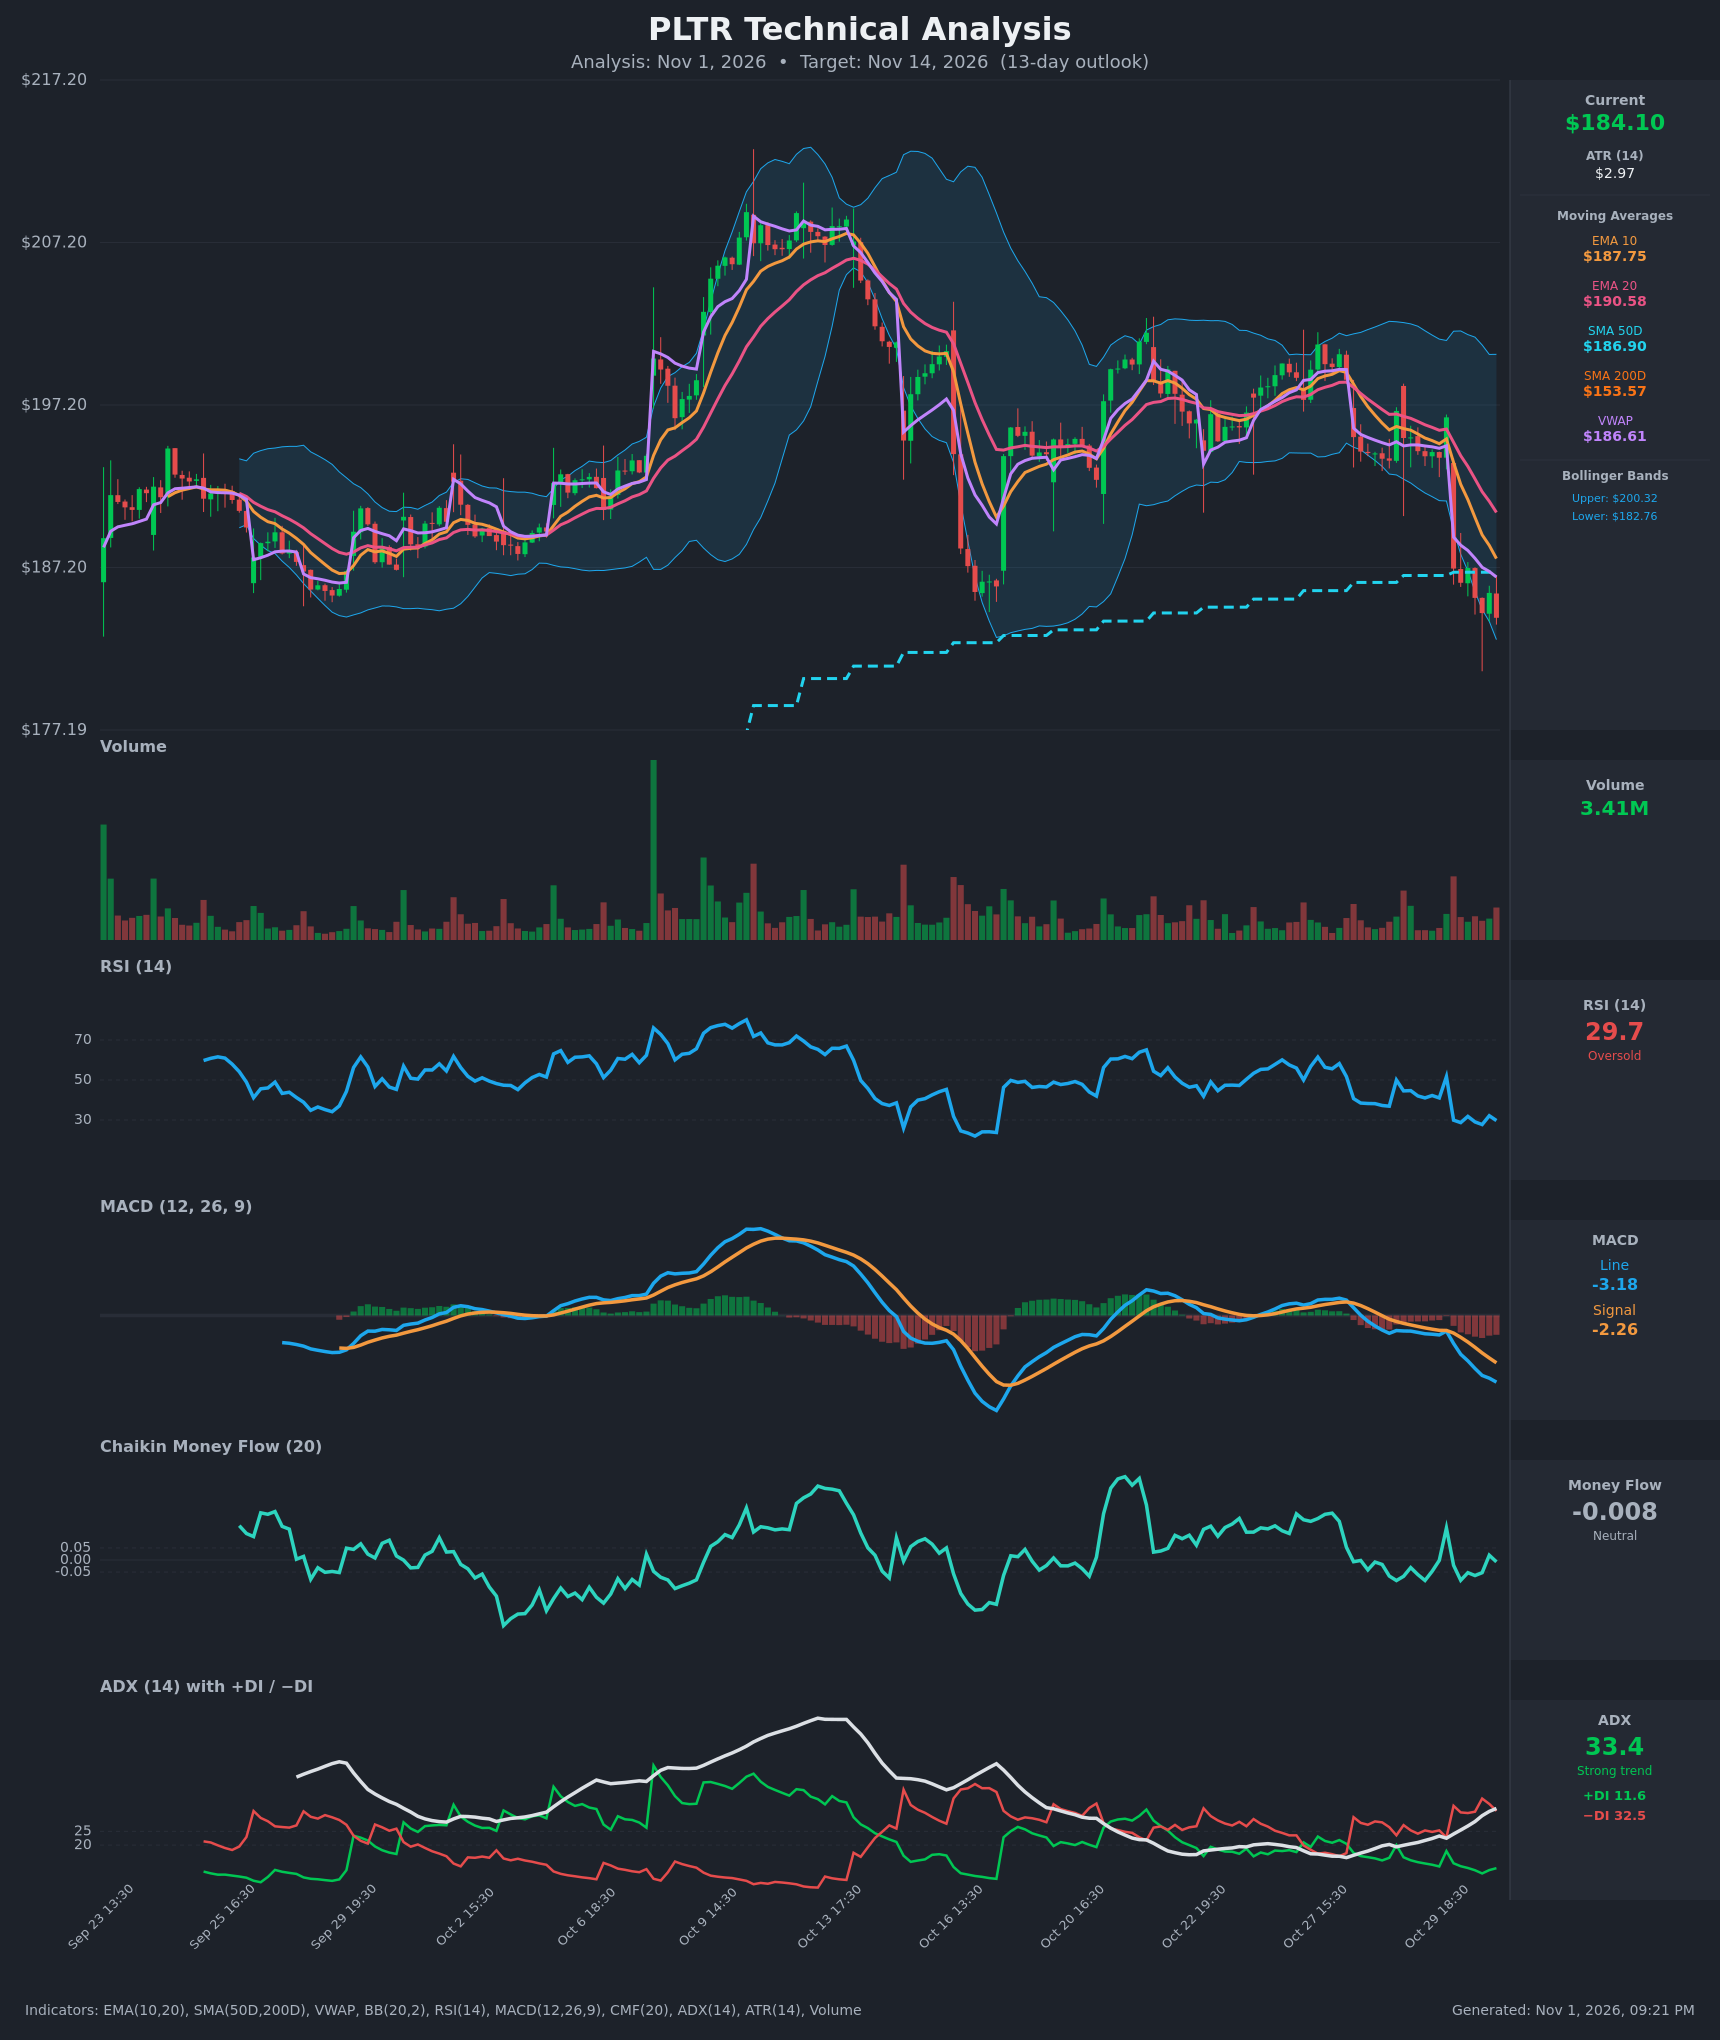
- RSI (14): 29.72, in oversold territory after dropping from about 52 to 30 within a day or two (Oct 29 19:30 to Oct 30 13:30). It has stayed in the 28-32 band for the last 7 bars, so momentum is still pointing down. There is no bullish divergence yet. [Bearish]
- 20 EMA: $190.58, and price at $184.10 is about 3.4% below it. The EMA10 ($187.75) sits below the EMA20, a bearish cross that happened around Oct 30. Both slope down and act as overhead resistance. [Bearish]
- MACD: Line -3.18 is below Signal -2.26, with a negative histogram of about -0.92 that is still widening. The bearish crossover happened around Oct 30 and both lines are accelerating lower. [Bearish]
- Bollinger Bands (20): Upper $200.32, lower $182.76, midline about $191.5. Price is hugging the lower band, with a recent wick below it. Bands are still wide, so a band-walk lower is possible, but a mean-reversion bounce toward the midline is also on the table. [Bearish]
- CMF (20): -0.008, inside the neutral zone (±0.05). It has chopped around zero without clear accumulation or distribution, so the selloff lacks strong volume-weighted confirmation. [Neutral]
- ADX (14): 33.4 and rising, with -DI at 32.5 far above +DI at 11.6. This is a strong, established downtrend with bears firmly in control. [Strong Trend – Bearish]
- Volume: 3.41M, moderate and not climactic. The large red bars during the Oct 30 gap-down show real selling, but there is no capitulation spike to signal a washout bottom. [Neutral-to-Bearish]
Other levels:
- VWAP ($186.61): above price, a bearish positioning signal.
- SMA50D ($186.90): just broken, now overhead resistance.
- SMA200D ($153.57): far below, so the long-term uptrend is still intact. This limits the damage but also shows how much room there is to fall.
DIVERGENCES & TRENDS
- No bullish RSI or MACD divergence is present. MACD and RSI are making fresh lows together with price, so momentum confirms the move.
- The Oct 30 gap-down from about $196 to $187 broke the 193-197 consolidation floor, and price then slid in a staircase to $184.
- EMA10 has crossed below EMA20, price is below EMA10, EMA20, SMA50D and VWAP, and the MACD crossover is bearish. This is a stack of bearish crossovers.
- ADX has risen from about 19 to 33 as -DI expanded, so trend strength is increasing, not fading.
- RSI near 30 is a warning against chasing shorts, since sharp relief bounces are common. In strong ADX downtrends, however, RSI can stay oversold for a while.
- The long-term trend is still up (SMA50D far above SMA200D, no death cross).
CHART PATTERNS
- Breakdown from a range / lower high structure: Price topped near $208 (Oct 10-13), then made a lower high around $199 on Oct 27, and has now broken below the $186-187 support zone. This is loosely like a Bearish Double Top / Triple Top breakdown. The measured move toward the SMA200D area is long-range, but near-term pressure points to $178-180.
- Bearish continuation tone: The sideways drift followed by a gap-down resembles a Bearish Flag/Pennant breakdown. The trigger was the gap below $194.
- Resistance retest zone: The $186.90-$190.58 zone (SMA50D, VWAP, EMAs) is likely to cap any relief rally.
POTENTIAL SCENARIOS
- Scenario 1: Bearish Trend Continuation — Strong ADX and -DI dominance keep pressure on price. Any bounce fades at the SMA50D/VWAP area and sellers push price toward the recent wick low and below. Trigger: failure to reclaim $186.90 and a close below $182.76 (lower BB). Target: $178-$180, with an extension to $175. Invalidation: daily close above $190.60 (EMA20). (45% probability)
- Scenario 2: Bullish Oversold Relief Bounce — RSI near 30 and price at the lower Bollinger Band trigger short covering and a mean-reversion rally toward the middle band. Trigger: reclaim of $186.90 on rising volume with RSI turning above 35. Target: $190-$192 (EMA20/BB midline). Invalidation: loss of $179. (38% probability)
- Scenario 3: Neutral Basing Range — Price stabilizes between roughly $179 and $187 as momentum cools and ADX rolls over. Trigger: low-volume consolidation with RSI hovering 30-40. Target: $182-$186. Invalidation: a close beyond either edge of the range. (17% probability)
PRICE TARGETS
- Target Price: $180.50 (13-day horizon)
- Expected Range: $173.50 to $188.50 (width $15.00, about 8.1% of current price, consistent with the 7-21 day guidance for a 13-day horizon)
- Key Levels: Support at $178.50, Resistance at $186.90
OVERALL BIAS
OVERALL BIAS: BEARISH - Price is below all key short-term moving averages and VWAP, MACD has crossed bearishly with an expanding negative histogram, and ADX at 33 with -DI far above +DI shows a strong downtrend. Conviction is modest because RSI near 30 and the lower Bollinger Band make a relief bounce a real possibility, but the SMA50D/VWAP zone near $187 should cap rallies.
This is educational analysis and not financial advice.