RKLB 13-day bearish forecast — Nov 1, 2026
- Bias: Bearish
- Timeframe: 13 days (made Nov 1, 2026, target date Nov 13, 2026)
- Price at analysis: $54.72
- Price target: $52.60
- Expected range: $50.00 – $56.00
- Result: Incorrect (+12.4%) — closed at $61.53 on Nov 13, 2026; quality score 0/100
Get a free AI analysis of RKLB today
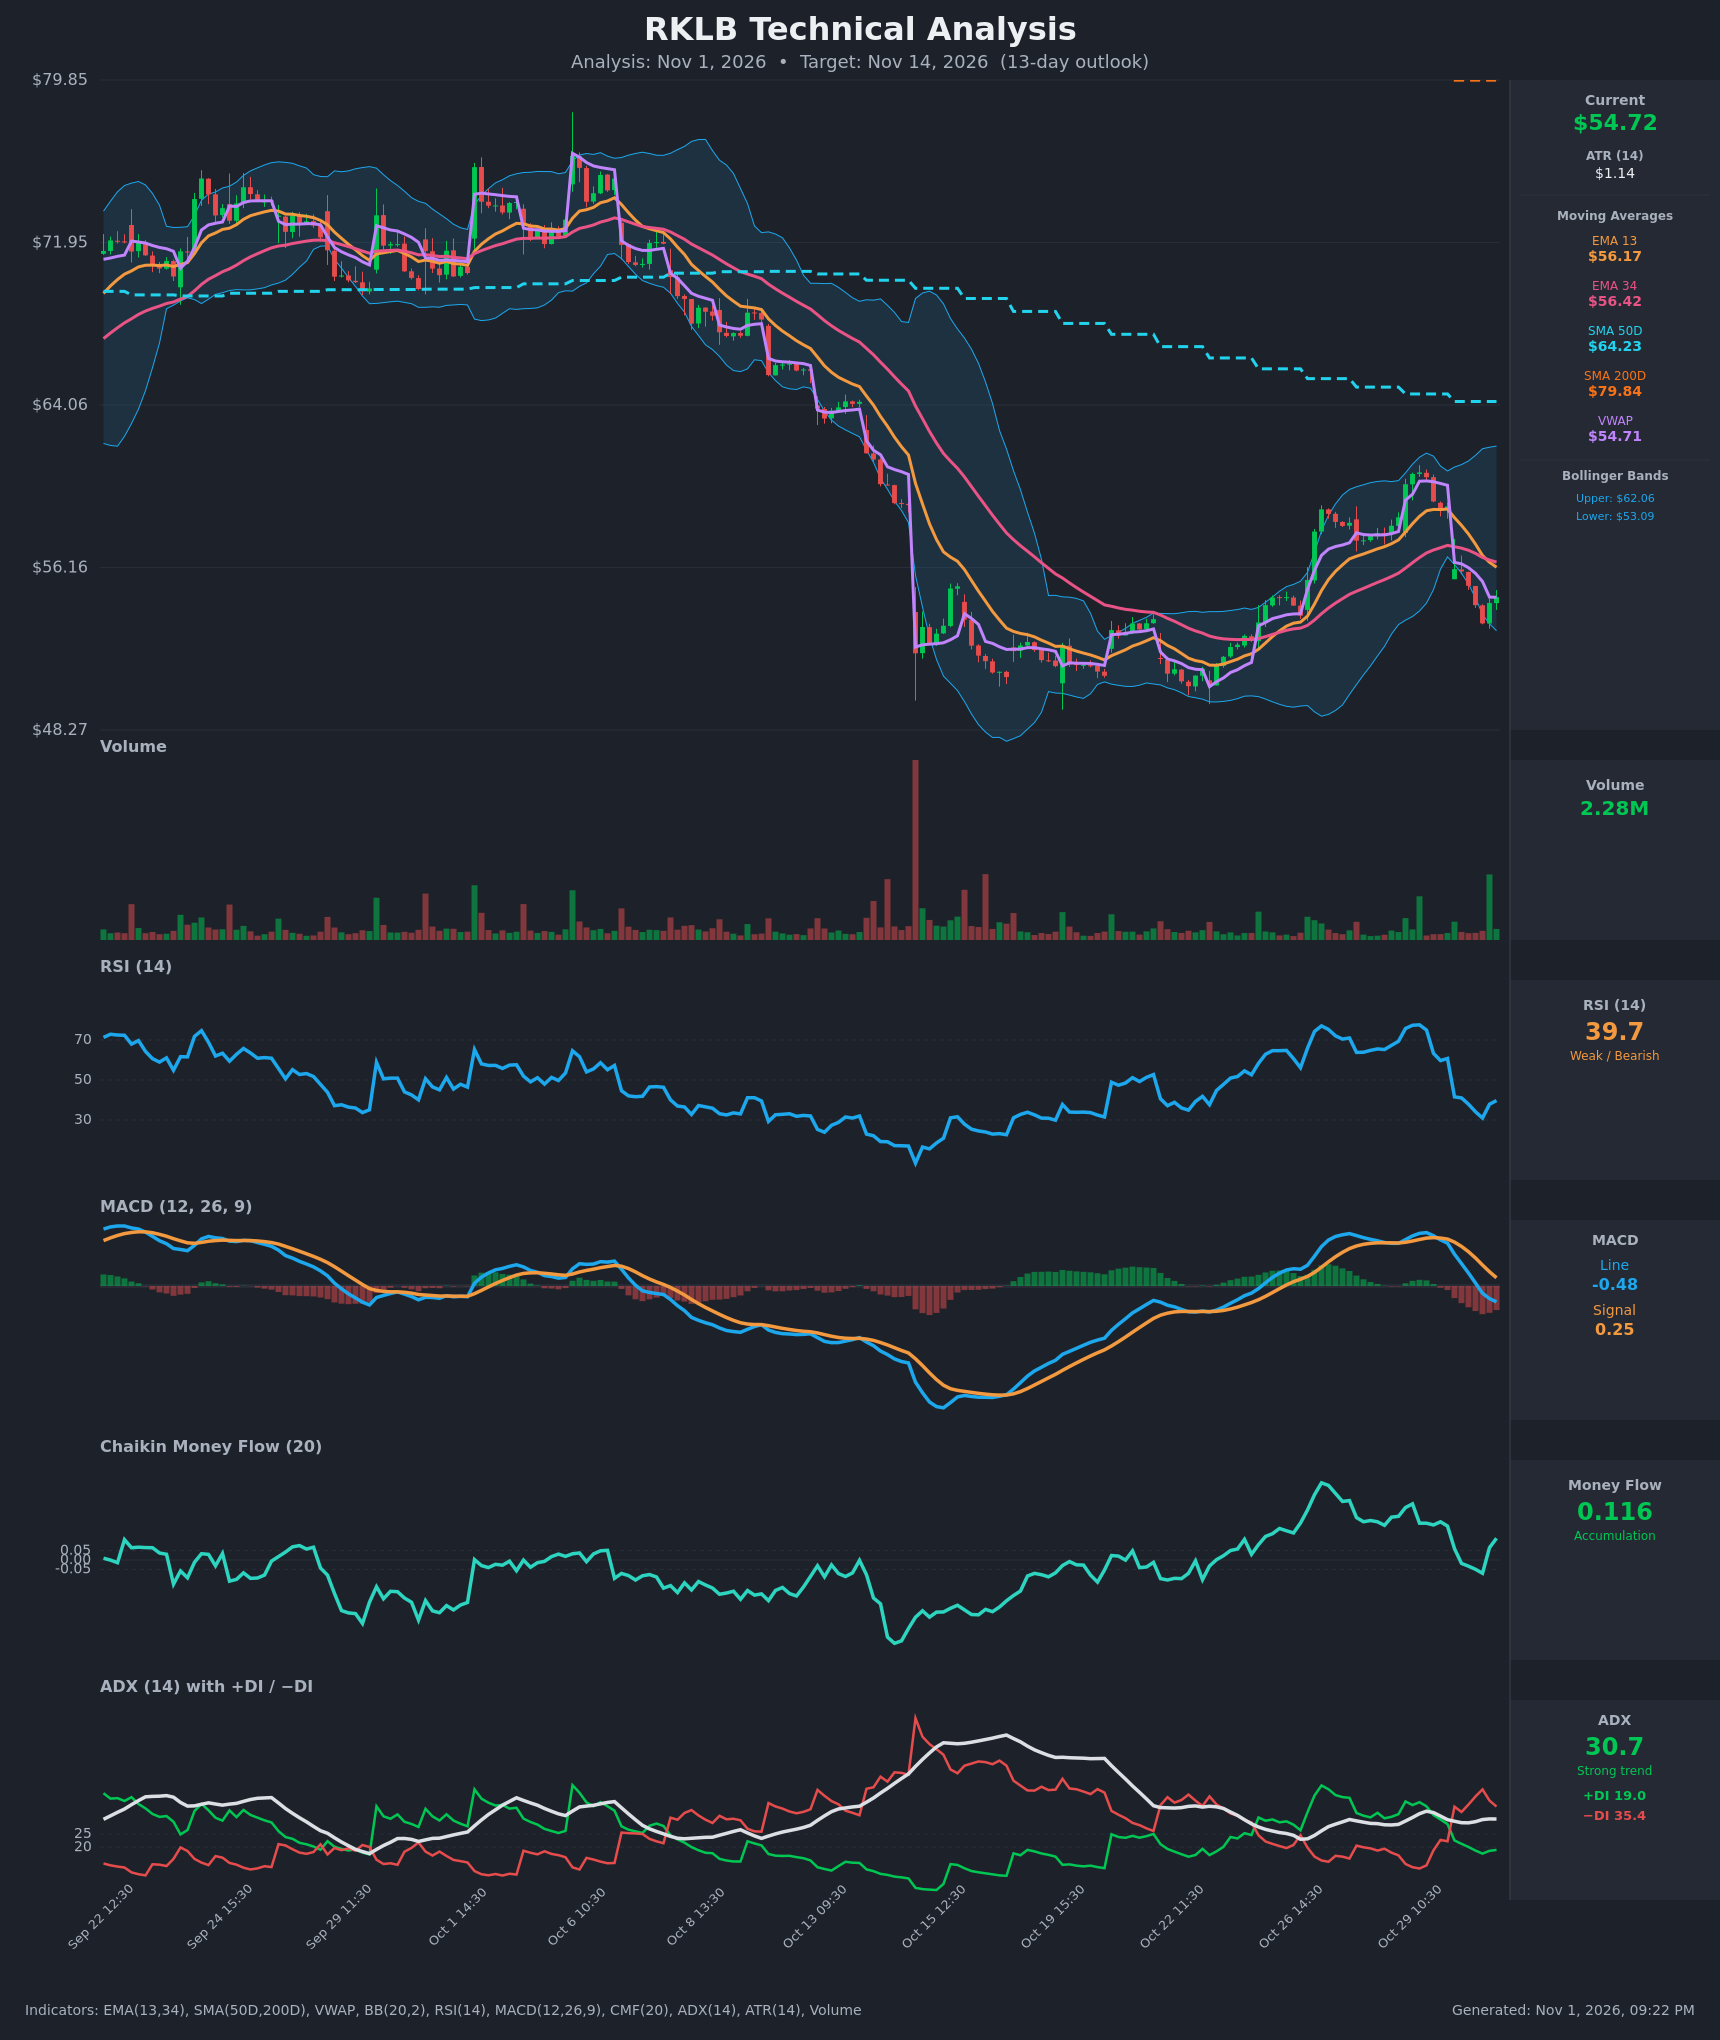
Analysis
TECHNICAL INDICATORS
- RSI (14): 39.73, bouncing from an oversold-edge low of about 31 (Oct 30 13:30) but still below 50. It fell from 77 to 31 in a day and a half, so momentum has flipped sharply bearish, and the bounce is only a partial recovery. [Bearish]
- 20 EMA (EMA 13 / EMA 34 used): EMA 13 is $56.17 and EMA 34 is $56.42. Price at $54.72 is below both, and EMA 13 just crossed below EMA 34 (Oct 30 14:30), so both now act as overhead resistance. [Bearish]
- MACD: Line -0.48 is below Signal 0.25, after a bearish crossover on Oct 30 13:30. The histogram is negative and widening. The line has crossed below zero, so momentum is clearly rolling over. [Bearish]
- Bollinger Bands (20): Upper $62.06, lower $53.09. Price is hugging the lower band after being rejected near the upper band (about $61) on Oct 29. The bands are wide, so volatility is elevated. A lower-band touch can bring a bounce, but a "walk" down the band is also possible. [Neutral]
- CMF (20): +0.116, above the +0.05 threshold, and it just turned back up from negative (-0.071). That points to dip buying at the lows, but it is a short-term bounce signal against a bearish trend. [Accumulation]
- ADX (14): 30.7 with −DI 35.4 well above +DI 19.0. The trend is strong and the sellers are in control. The DI cross to bearish on Oct 30 09:30 confirms the shift. [Strong Trend – Bearish]
- Volume: 2.28M on the latest bar, one of the larger green spikes in recent weeks. It suggests a bounce attempt or buyers stepping in near $53.5. The bigger volume spikes earlier were on selloff days, so selling pressure is still the heavier force. [Mixed – tentative dip buying]
DIVERGENCES & TRENDS
- Price made a new swing low near $53.45 while CMF turned up from negative to +0.116. This is a minor bullish divergence in money flow, but it is a one-bar signal and unconfirmed.
- MACD has crossed bearish while RSI is only at 40. There is room to fall before RSI becomes oversold, so downside momentum is not exhausted.
- Price is below SMA50D ($64.23) and SMA200D ($79.84). SMA50D is under SMA200D, a death cross that was already in place. The longer-term trend is down.
- EMA 13 crossed below EMA 34, a short-term bearish crossover.
- ADX is above 25, −DI is above +DI, and the DI spread is widening.
- The Oct 30 gap down from $59 to $56 erased most of the prior two-day rally. This is a failed breakout and a lower high relative to the earlier decline.
- Price is at VWAP ($54.71), so there is no edge from that indicator.
CHART PATTERNS
- Bearish Rising Wedge / failed recovery: The climb from about $50.5 to about $61 was a corrective, rising structure. Its sharp breakdown through the EMAs resembles the bearish rising wedge from the reference diagram, with a measured move back toward the start of the wedge (about $50–51).
- Bearish Flag, broader context: The downtrend from $75 to $50, followed by a weak rally that was capped well below SMA50D, resembles a continuation structure. The target is a retest or break of the $50–50.5 lows.
- Support to watch: The prior low zone of $50–51 is the base of a potential double bottom. A bounce there is plausible, but a break would open a new leg lower.
POTENTIAL SCENARIOS
- Scenario 1: Bearish Continuation Toward Prior Lows — The failed recovery and the bearish MACD/EMA/DI alignment push price through the lower Bollinger Band toward the prior swing lows. Trigger: a close below $53.00–53.09 on rising volume. Target: $50.50–51.50. Invalidation: a daily close above $56.50 (EMA 34). (50% probability)
- Scenario 2: Bullish Relief Bounce — The CMF turn-up and lower-band support fuel a mean-reversion bounce back to the moving averages and VWAP area. Trigger: a reclaim of $56.20–56.40 (EMA 13/34). Target: $58.00–59.00. Invalidation: a break below $53.00 (lower band, recent low). (30% probability)
- Scenario 3: Neutral Chop Near the Lower Band — Price consolidates between $52.50 and $56.00 as the oversold bounce and the downtrend offset each other. Trigger: low-volume inside days. Target: $53.50–55.50. Invalidation: a close outside $52.50–56.50. (20% probability)
PRICE TARGETS
Timeframe: 13 days (Nov 14, 2026).
- Target Price: $52.60
- Expected Range: $50.00 to $56.00 (width $6.00, about 11% of the current price, in line with the 8–12% guidance for 13–14 days)
- Key Levels: Support at $53.00, Resistance at $56.20
OVERALL BIAS
OVERALL BIAS: BEARISH - Price is below all key moving averages with a bearish MACD cross, EMA 13/34 cross and −DI dominating a strong ADX of 30.7, and the recent rally failed well below SMA50D. The positive CMF and lower-band proximity make a bounce likely, but it should find resistance near $56.
This is educational analysis and not financial advice.