AMD 20-day bearish forecast — Nov 1, 2026
- Bias: Bearish
- Timeframe: 20 days (made Nov 1, 2026, target date Nov 20, 2026)
- Price at analysis: $504.80
- Price target: $490.00
- Expected range: $472.00 – $530.00
- Result: Pending — graded after the close on Nov 20, 2026
Get a free AI analysis of AMD today
Analysis
TECHNICAL INDICATORS
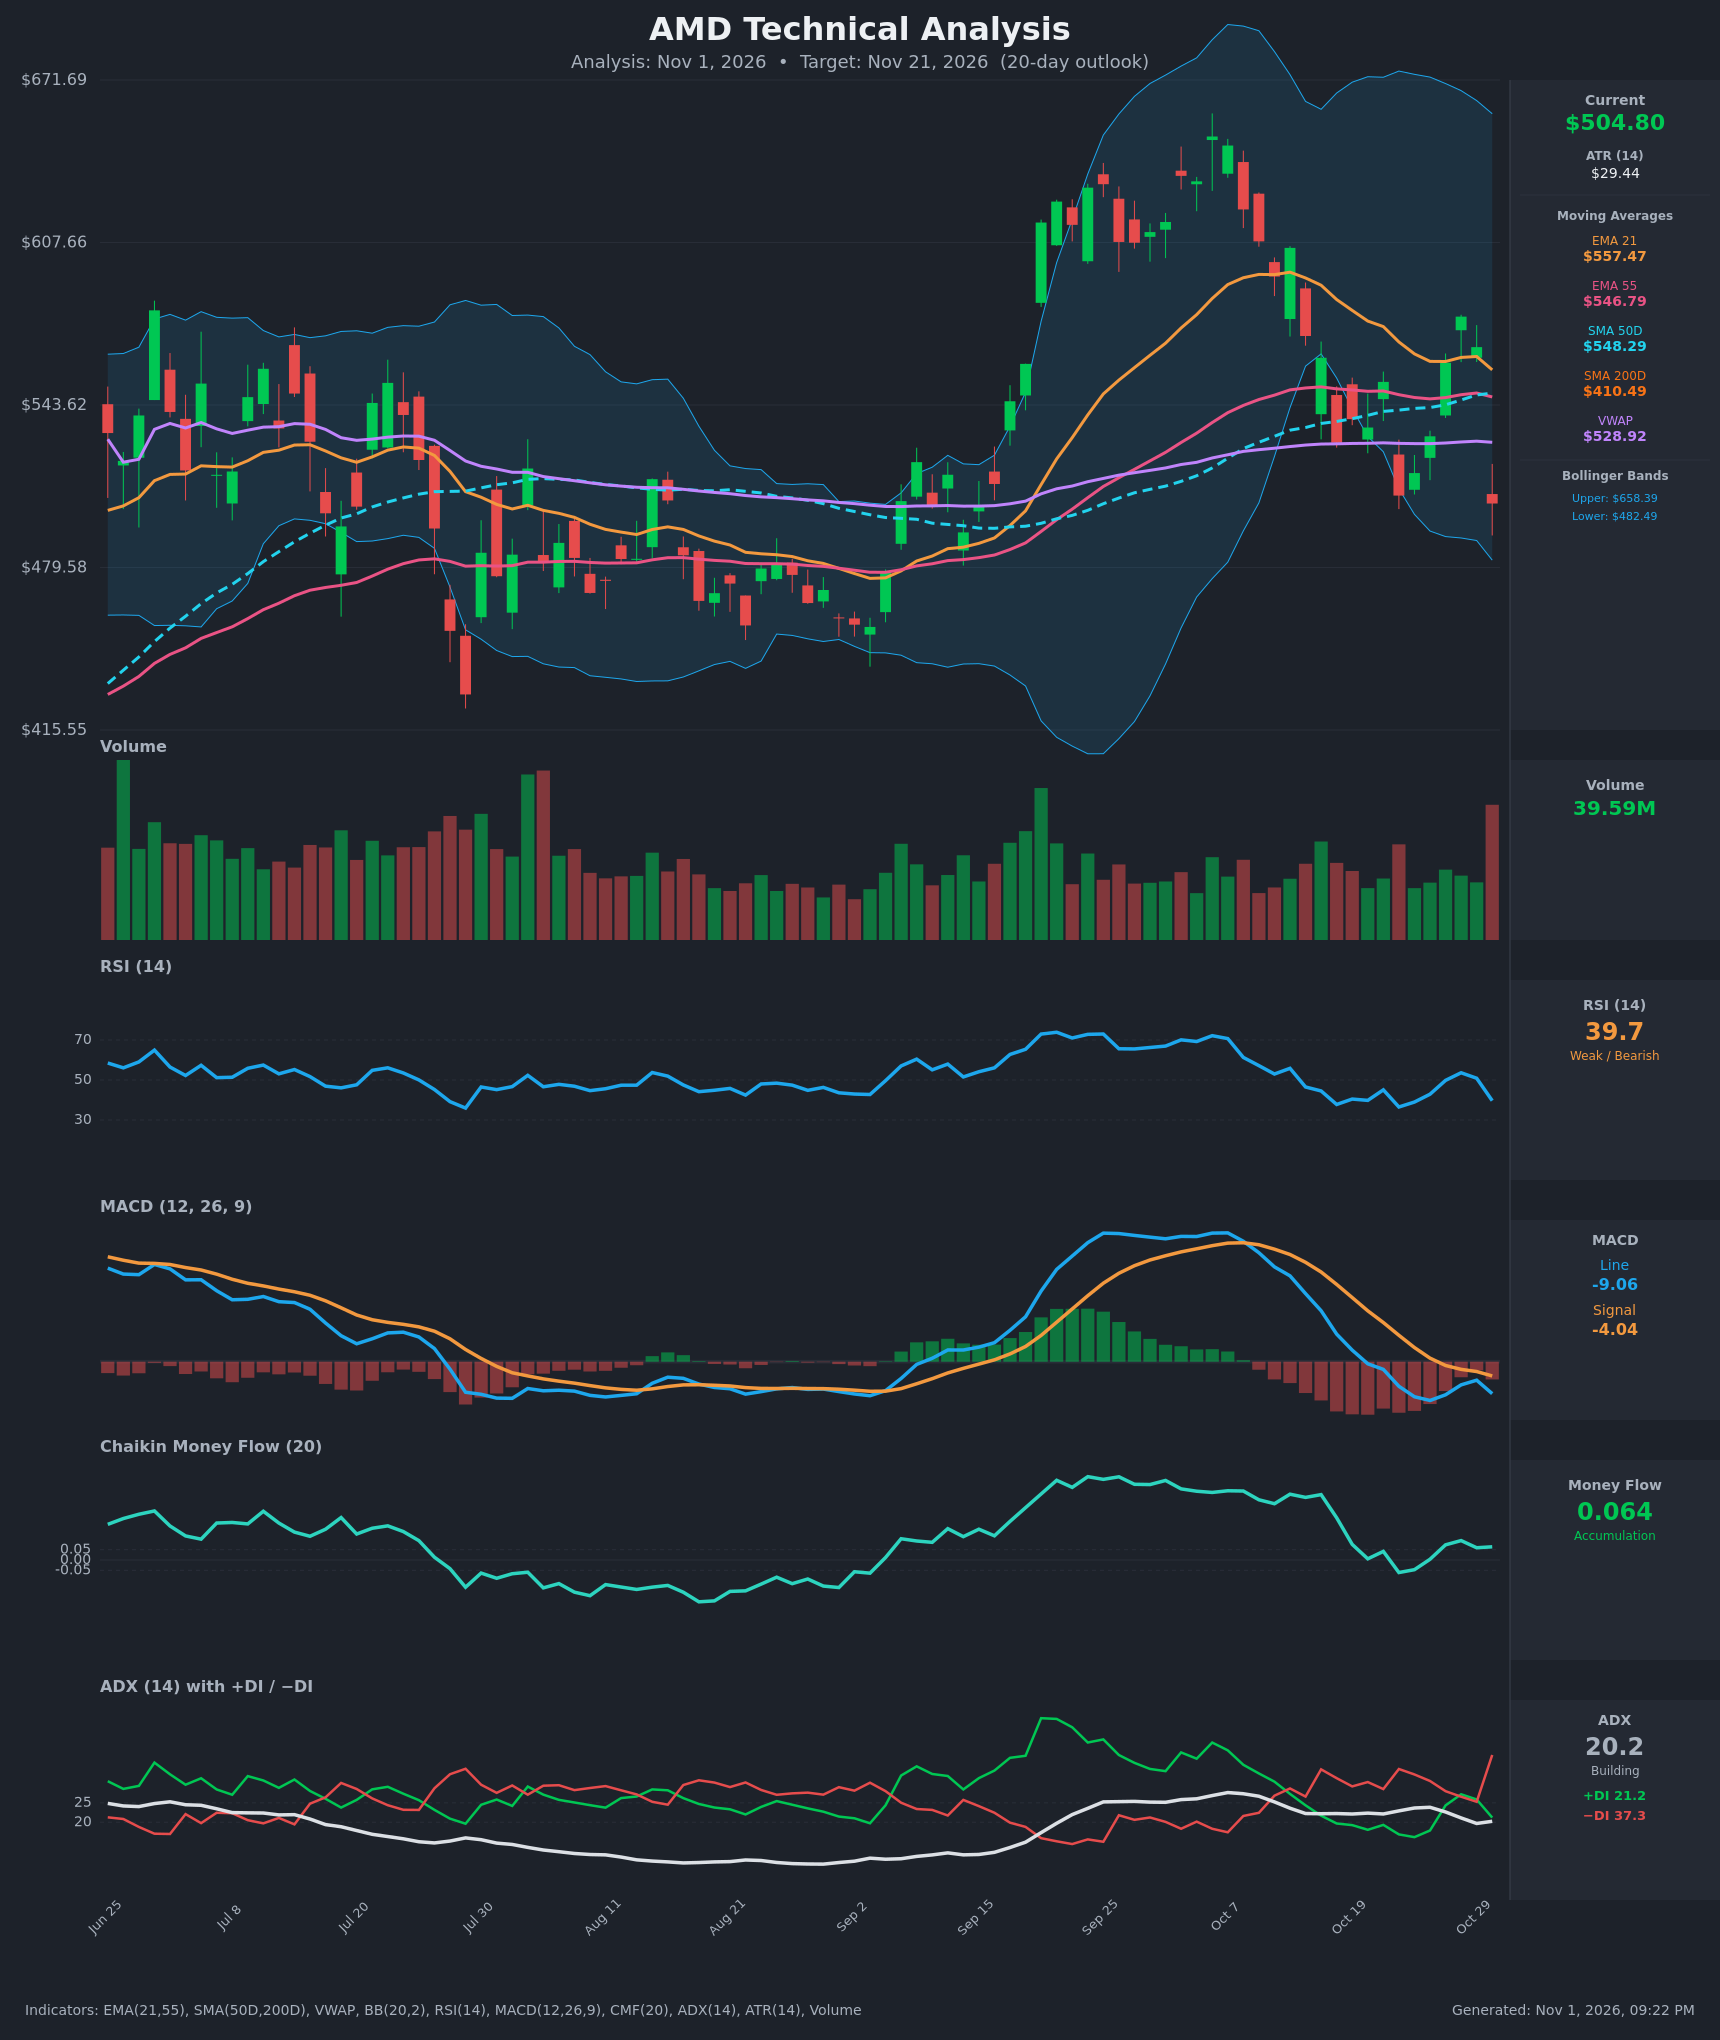
- RSI (14): 39.67, down sharply from 50.9 on Oct 29. It is below 50 and approaching oversold (30) but not there yet. Momentum is weak, and the series of lower RSI peaks (53.6 on Oct 28 vs. 55.8 on Oct 13) confirms fading strength. [Bearish]
- 20 EMA (EMA 21 = $557.47): Price at $504.80 is about 9.4% below it, so the EMA acts as overhead resistance. The EMA is rolling over and converging on EMA 55 ($546.79). A bearish EMA21/EMA55 cross is plausible in the coming sessions. [Bearish]
- MACD: Line -9.06 is below signal -4.04, and the bearish crossover occurred around Oct 27 after a brief hold. The histogram is negative and widened again on the latest bar. The line is below zero, so momentum is downward. [Bearish]
- Bollinger Bands (20): Upper $658.40, lower $482.49, so price sits in the lower quarter of the bands, about $22 above the lower band. The bands are still very wide from the September-October volatility expansion and are starting to contract. A tag of the lower band is possible, and a close below it would signal continuation or a short-term oversold bounce. [Bearish]
- CMF (20): 0.064, marginally above the +0.05 threshold and well below the 0.3 readings of mid-October. It is still technically accumulation, but the trend is deteriorating and the latest red high-volume bar is not yet fully reflected. [Neutral]
- ADX (14): 20.2, with +DI at 21.2 and −DI at 37.3. ADX is borderline and recently rising from its lows, but −DI is far above +DI (a 16-point gap) and spiked on the last bar. This points to bears in control within a developing, still modest, downtrend. [Weak Trend + Bearish direction]
- Volume: 39.59M, the largest bar on the chart's recent window, on a red candle that closed at $504.80 (-10.9%). A big down move on heavy volume signals distribution or capitulation-type selling. It could mark a short-term climax, but follow-through is more likely than not. [Bearish]
Other moving-average context from the data:
- VWAP: $528.92. Price is below it, which shows sellers in control, and the VWAP is the nearest overhead resistance.
- SMA50D / SMA200D: $548.29 / $410.49. Price is below the 50D but well above the 200D. The golden cross has already occurred, so the long-term trend remains up while the intermediate trend has turned down.
DIVERGENCES & TRENDS
- No clear bullish divergence yet. RSI at 39.67 is above its Oct 22 low of 36.5 while price is now below that day's close of $507.93, which is a mild bullish tilt only because RSI reads slightly higher than the prior low at a lower price. This needs confirmation by a close above $530.
- MACD and RSI are making lower highs along with price (lower highs at $605, $578, $566). This confirms a short-term downtrend rather than diverging from it.
- CMF has fallen from 0.318 to 0.064 over two weeks while price dropped. This is a slow loss of buying pressure, a warning rather than a divergence.
- Crossovers and breaks:
- MACD bearish crossover (Oct 27).
- Price closed below EMA21, EMA55, SMA50D and VWAP.
- Price lost the $507-$510 support area intraday on Oct 22 and has now closed below it.
- EMA21 is converging on EMA55 and could cross down soon.
- −DI has crossed far above +DI.
CHART PATTERNS
- Failed breakout / rounded top (closest reference: Bearish Head and Shoulders / Double Top style reversal): The September breakout to about $655 failed. Price made lower highs ($605, $578) and has returned to the former breakout area. The pattern is loose rather than textbook, so treat it with moderate confidence.
- Bearish Pennant/Flag-like consolidation: The Oct 19-Oct 29 bounce into $578 and reversal looks like a minor rising counter-trend channel that has now broken down. A measured move targets roughly the $470-$485 area.
- Base support: The July-September base ($415-$545) with a midpoint near $480 aligns with the lower Bollinger Band at $482.49, making this the major support zone.
- Significance: A break below $482 opens $450-$460 (the late-August/early-September breakout zone). Reclaiming $529-$535 would invalidate the bearish structure.
POTENTIAL SCENARIOS
- Scenario 1: Bearish Continuation to the Lower Band — The heavy-volume breakdown, negative MACD and dominant −DI lead to a drift lower toward the base support. Trigger: failure to reclaim $515-$520 and a close below $495. Target: $475-$490, with a tail toward $460. Invalidation: daily close above $529 (VWAP). (50% probability)
- Scenario 2: Neutral Oversold Bounce and Range — Heavy volume marks a short-term climax, RSI holds above 30, and price holds the $482-$490 zone and bounces to the $520-$530 area before stalling. Trigger: hold of $482 with a bullish candle and volume contraction. Target: $515-$530. Invalidation: close below $480 or above $530. (30% probability)
- Scenario 3: Bullish Reversal and Reclaim — Buyers defend the dip (CMF still positive, price well above the SMA200D) and push back above VWAP and the EMAs. Trigger: close above $529 with MACD histogram turning up. Target: $550-$557 (EMA21/SMA50D). Invalidation: close back below $505. (20% probability)
PRICE TARGETS
- Target Price: $490.00 (20-day horizon)
- Expected Range: $472.00 to $530.00 (width $58 = about 11.5% of current price, consistent with the 14-21 day guidance)
- Key Levels: Support at $482.49 (lower Bollinger Band), Resistance at $528.92 (VWAP)
OVERALL BIAS
OVERALL BIAS: BEARISH - Price is below EMA21, EMA55, SMA50D and VWAP, MACD is in a bearish crossover, −DI (37.3) dominates +DI (21.2), and the latest bar was a heavy-volume breakdown. The cushion is the lower band and base support near $482, plus a still-positive CMF and the SMA200D far below, which limit the downside and make a bounce a real risk.
This is educational analysis and not financial advice.