SOFI 13-day bullish forecast — Nov 1, 2026
- Bias: Bullish
- Timeframe: 13 days (made Nov 1, 2026, target date Nov 13, 2026)
- Price at analysis: $16.75
- Price target: $17.10
- Expected range: $16.20 – $17.80
- Result: Incorrect (-8.0%) — closed at $15.42 on Nov 13, 2026; quality score 4/100
Get a free AI analysis of SOFI today
Analysis
TECHNICAL INDICATORS
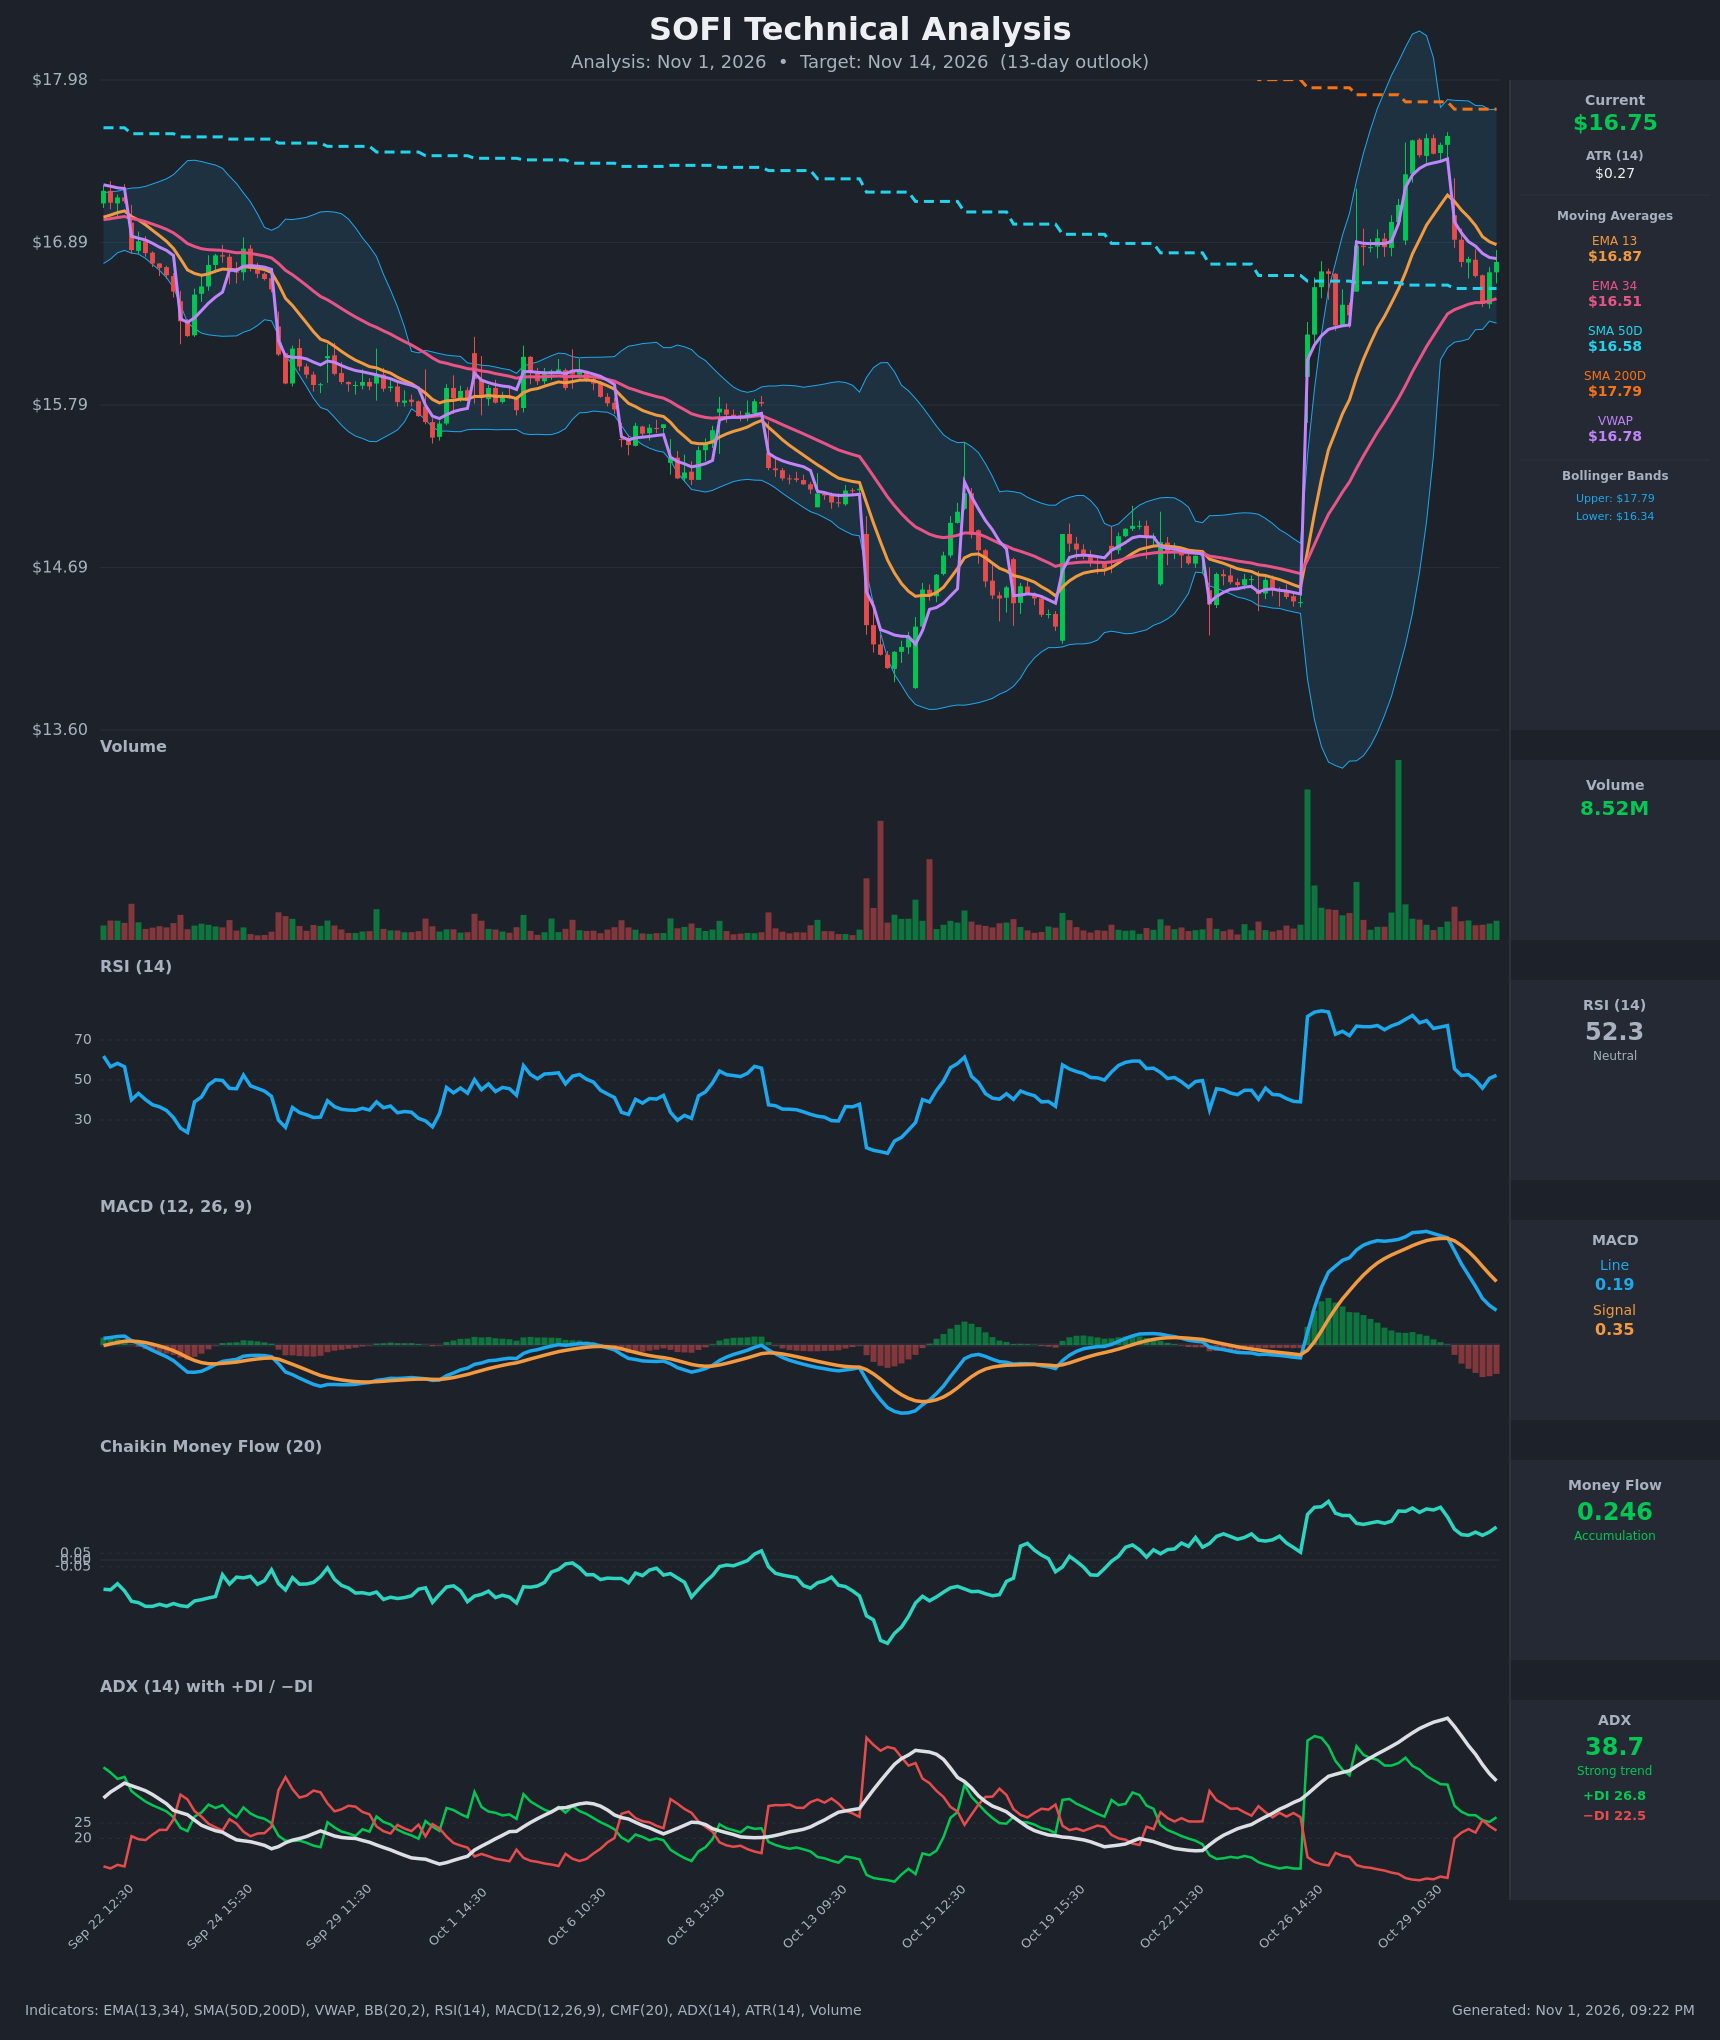
- RSI (14): 52.34, dropped from 75-82 (overbought) on Oct 29 to the neutral midline. It bottomed at 45.9 and is ticking up. The overbought momentum has fully reset. [Neutral]
- 20 EMA (EMA 13 / EMA 34 used): EMA 13 is $16.87, just above price ($16.755) and acting as near-term resistance. EMA 34 is $16.51 and rising, acting as support about 1.5% below. Price sits between the two. EMA 13 is still well above EMA 34 (no bearish cross), but the gap is narrowing. [Neutral]
- MACD: Line 0.191 is below signal 0.350, with a negative and widening histogram. A bearish crossover happened on Oct 29-30 from a peak of about 0.63. Momentum is fading, but the line is still above zero, so this reads as a pullback rather than a trend reversal. [Bearish]
- Bollinger Bands (20): Upper $17.785, lower $16.343, midline about $17.06. Price is in the lower half of the bands after the Oct 27-29 expansion. The bands are wide and starting to contract, and the midline is about 1.8% above price, so a reversion target exists. [Neutral]
- CMF (20): +0.246, well above the +0.05 threshold. It fell from 0.39 but has held above 0.18 throughout the pullback, so the dip is not showing distribution. [Accumulation]
- ADX (14): 38.7, strong but falling from 59 as the impulse cools. +DI (26.8) is above −DI (22.5), but the spread has narrowed sharply from 37 vs 7. −DI touched +DI at 25.9 on the Oct 30 13:30 bar before bulls regained the lead. The trend is strong but decelerating. [Strong Trend, fading, slight bullish tilt]
- Volume: 8.52M, near the recent average. Pullback volume is far lighter than the huge green breakout bars, which means sellers are not aggressive. VWAP is $16.78, and price is slightly below it. [Mildly Bullish]
DIVERGENCES & TRENDS
- MACD: It has crossed bearish and the histogram is deepening negative, while price has held above the 34 EMA and 50 SMA. This is a momentum cooldown, not a true divergence.
- RSI/CMF: RSI reset to 52 while CMF stays strongly positive. This is mild bullish confirmation that money flow is not leaving.
- ADX/DI: ADX has rolled over from its peak and the DI spread has collapsed, signalling the impulse leg is exhausted.
- Moving averages: Price is above SMA 50 ($16.58) but below SMA 200 ($17.79). The SMA 50 is below the SMA 200 (no golden cross), so the long-term structure is still unrepaired. SMA 200 and the upper Bollinger Band cluster near $17.79 as major overhead resistance.
- Recent price action: Price gapped up from about $14.4 to $16.3 and ran to $17.6. It then lost about $1.1 and stalled at $16.48-$16.75, right on the EMA 34/SMA 50 support cluster.
CHART PATTERNS
- Bullish Flag / Pennant (continuation): The sharp impulse from about $14.4 to $17.6 was followed by a shallow, lower-volume, descending pullback to $16.5. That is a loose match for the Bullish Flag. It is not a textbook pattern, since the pullback has been steep and fast. A breakout above the flag's upper boundary (about $17.0-$17.1) would target the prior high of $17.6. The full measured move is much larger, but SMA 200 at $17.79 caps it realistically.
- Gap support: The open gap from $14.4 to $16.3 is the major downside reference if $16.4-$16.5 fails.
- Risk: A close below $16.34 (lower BB) would turn the pullback into a failed-breakout / lower-high structure.
POTENTIAL SCENARIOS
- Scenario 1: Bullish Flag Breakout / Mean Reversion — Price holds the EMA 34/SMA 50 support cluster and CMF accumulation pulls it back to the Bollinger midline and the EMA 13 area, then toward the prior high. Trigger: close above $16.90 (EMA 13) and then $17.10. Target: $17.10 first, then $17.60. Invalidation: close below $16.40. (50% probability)
- Scenario 2: Bearish Failed Breakout — The MACD bearish cross extends, the histogram deepens, and ADX fades, so price loses the $16.5 cluster and fills part of the gap. Trigger: close below $16.34 (lower BB) on rising volume. Target: $15.80, then $15.30. Invalidation: reclaim of $16.90. (30% probability)
- Scenario 3: Neutral Consolidation — Price chops between $16.40 and $17.00 as momentum resets and ADX drops toward 25. Trigger: repeated failures at EMA 13 and holds at EMA 34. Target: $16.70-$16.90. Invalidation: close outside $16.30-$17.20. (20% probability)
PRICE TARGETS
- Target Price: $17.10 (13-day)
- Expected Range: $16.20 to $17.80 (width $1.60, about 9.5% of current price, consistent with the 8-12% guidance for roughly two weeks)
- Key Levels: Support at $16.50 (EMA 34/SMA 50 cluster, recent low $16.48), Resistance at $17.60 (Oct 29 swing high, just below SMA 200 at $17.79)
OVERALL BIAS
OVERALL BIAS: BULLISH - The pullback is holding the EMA 34/SMA 50 support cluster with strong CMF accumulation (+0.246), light-volume selling and a reset RSI, which supports a move back toward the Bollinger midline near $17.10. The bearish MACD cross, fading ADX and SMA 200 overhead at $17.79 limit conviction and cap the upside.
This is educational analysis and not financial advice.