SMH 13-day bearish forecast — Nov 1, 2026
- Bias: Bearish
- Timeframe: 13 days (made Nov 1, 2026, target date Nov 13, 2026)
- Price at analysis: $522.83
- Price target: $514.00
- Expected range: $492.00 – $540.00
- Result: Correct (-6.9%) — closed at $486.75 on Nov 13, 2026; quality score 87/100
Get a free AI analysis of SMH today
Analysis
TECHNICAL INDICATORS
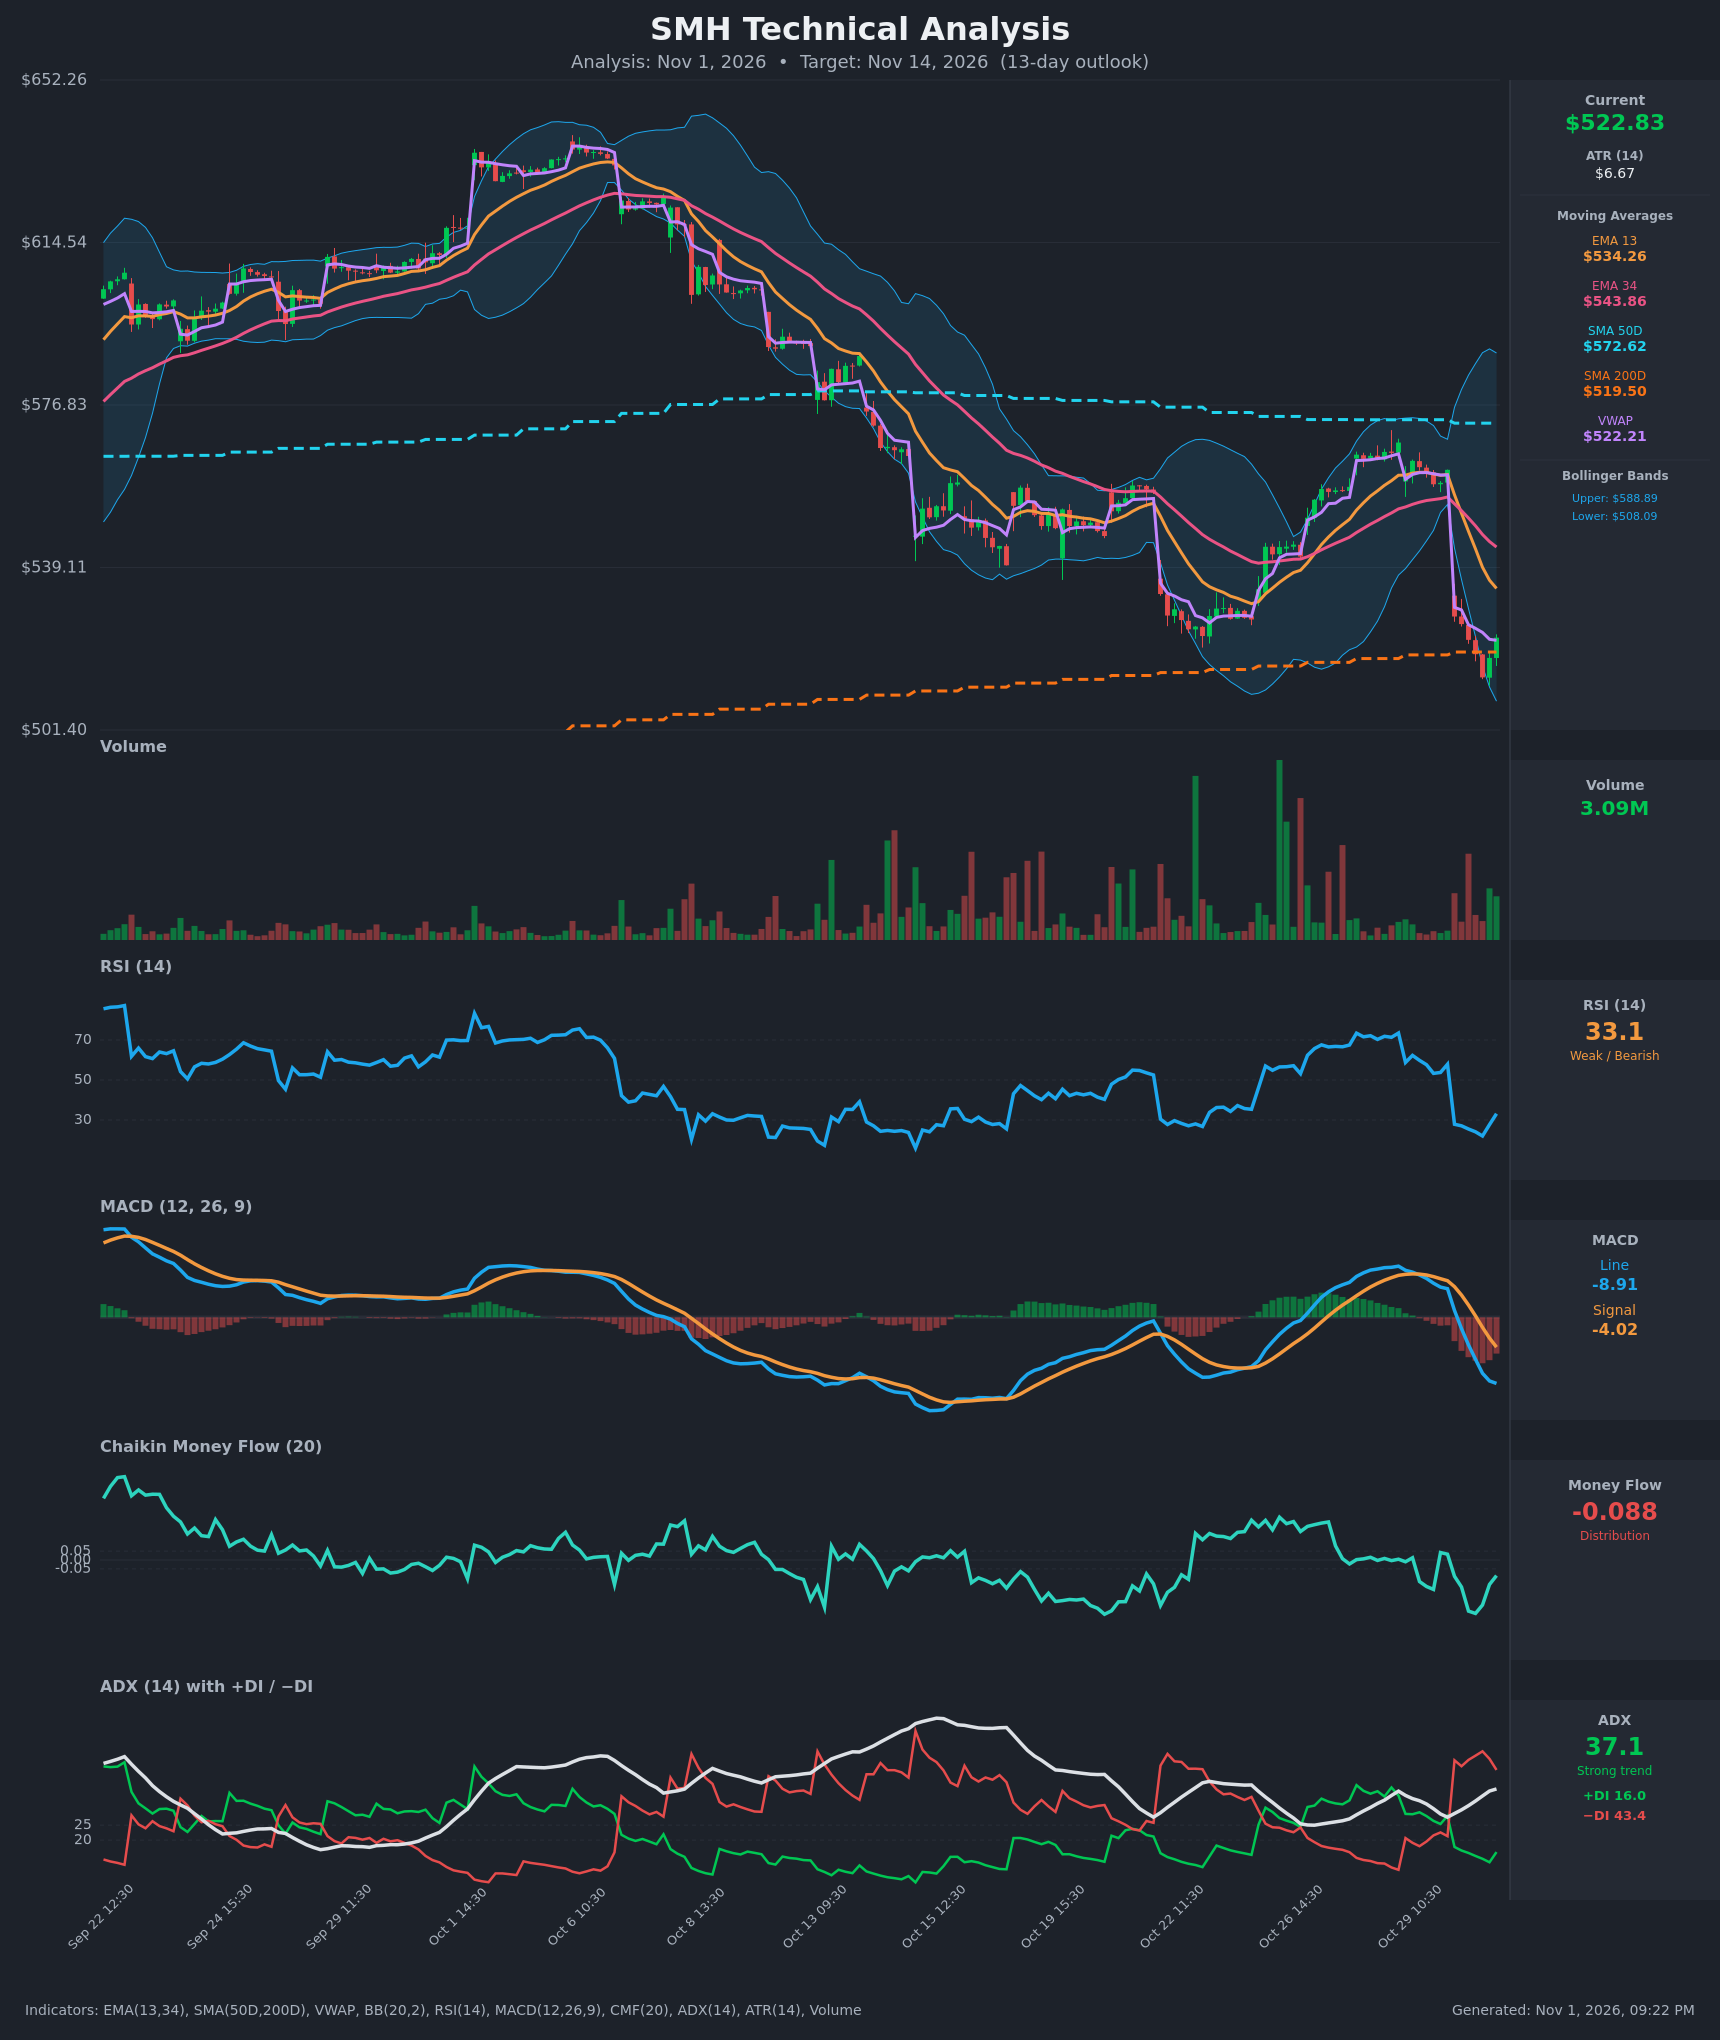
- RSI (14): 33.15, bouncing off a deeply oversold 22.0 low on Oct 30 (13:30 bar). It is still below 40 and in bearish territory, though the hook upward shows short-term relief. [Bearish]
- 20 EMA (EMA 13/34 shown): EMA13 is $534.26 and EMA34 is $543.86. Price at $522.83 is below both, and EMA13 is far below EMA34 and falling steeply (bearish cross around Oct 30 10:30). Both averages are now overhead resistance. [Bearish]
- MACD: Line -8.91 is below signal -4.02, a bearish crossover on Oct 30 that is still widening. The histogram is deeply negative at about -4.9. It is the weakest MACD reading in the window, though the line's rate of fall is slowing. [Bearish]
- Bollinger Bands (20): Upper $588.89, lower $508.09. Price is in the lower third, about $15 above the lower band. The bands are very wide after the gap-down, so volatility is elevated. Price walked down toward the lower band without closing below it, so a bounce is possible but there is no confirmed reversal. [Bearish]
- CMF (20): -0.088, below the -0.05 threshold. It was close to -0.30 earlier on Oct 30 and has recovered slightly, but it is still in distribution. [Distribution]
- ADX (14): 37.1 and rising, with -DI at 43.4 far above +DI at 16.0. This is a strong, bearish-controlled trend, and the gap between the DIs is wide. [Strong Trend – Bearish]
- Volume: 3.09M on the latest bar, mixed. The gap-down bar and sell-off carried above-average volume, while the latest bounce bar is only moderate. There is no capitulation spike, so selling does not look exhausted. [Neutral to Bearish]
Other levels:
- VWAP: $522.21, almost exactly at price, so there is no edge from that relationship.
- SMA200D: $519.50, which price is testing.
- SMA50D: $572.62, far overhead and well above price.
DIVERGENCES & TRENDS
- No bullish divergence yet. RSI made a low of 22 on a price low of about $513.6. The latest close ($522.83) is above that low, but there is no higher-low confirmation yet.
- Momentum. MACD, ADX and the DIs all made fresh extremes in the sell-off, so momentum confirms the move.
- Crossovers.
- EMA13 crossed below EMA34 and the gap is widening.
- MACD crossed below signal.
- -DI crossed above +DI sharply on Oct 30 (46.7 vs 17.7).
- Price versus SMA200D. Price is hovering at the 200-day average ($519.50), the last major long-term support. A decisive loss would shift the long-term bias to bearish.
- Lower highs. The Oct 28 rebound peaked at about $568, well below the early-October high near $640. Together with the new low near $513, this is a clear sequence of lower highs and lower lows.
- CMF. It is trying to curl up from its lows but remains negative, so there is no sign of real accumulation.
- SMA50D/SMA200D. SMA50D is still above SMA200D, so there is no death cross yet. The gap is narrowing, with SMA50D flat to slightly declining.
CHART PATTERNS
- No clean textbook reversal. The structure resembles a bearish continuation: a failed rally to the EMA34/SMA50 area and a gap down, producing lower highs and lower lows. It loosely resembles a bearish double top / head-and-shoulders on the larger scale (peak near $640 in early October, lower high near $568), with the neckline zone now around $519–$510.
- Significance and targets. A close below the neckline zone and SMA200D, around $508–$510, would project toward $490–$495. Key support sits at $519.50 (SMA200D), then $508 (lower Bollinger Band) and about $501 (recent low area on the chart axis).
- Short-term bounce. A small relief bounce (oversold RSI, price at SMA200D) is plausible. It would likely stall at EMA13 ($534) or VWAP/EMA34 ($544) and would be a bear-flag-type rally unless those levels are reclaimed.
POTENTIAL SCENARIOS
- Scenario 1: Bearish Breakdown Below SMA200D — A weak oversold bounce fails near EMA13 and sellers push price through the 200-day average. Distribution (negative CMF) and a strong ADX with -DI dominant support continuation. Trigger: a close below $519.50, then below $508. Target: $495–$505, with an extension to about $490. Invalidation: a daily close above $544 (EMA34). (50% probability)
- Scenario 2: Bullish Oversold Relief Bounce — RSI mean-reverts from oversold and price holds the 200-day average, squeezing toward the moving averages. Trigger: a reclaim of $534 (EMA13) with improving CMF above 0. Target: $540–$548. Invalidation: a close below $508. (35% probability)
- Scenario 3: Neutral Range Around the 200-Day Average — Price chops between $508 and $535 as volatility cools. Trigger: failure to break either $508 or $535. Target: $515–$530. Invalidation: a move outside that range on volume. (15% probability)
PRICE TARGETS
- Target Price: $514.00 (13 days, Nov 14, 2026)
- Expected Range: $492.00 to $540.00 (width $48 = ~9.2% of current price, consistent with a 13-day timeframe)
- Key Levels: Support at $519.50 (SMA200D, with $508.09 lower Bollinger Band below), Resistance at $534.26 (EMA13, with $543.86 EMA34 above)
OVERALL BIAS
OVERALL BIAS: BEARISH - Price is below its EMAs with a bearish MACD crossover, negative CMF, and ADX at 37 with -DI (43.4) far above +DI (16.0). Any oversold bounce faces overhead resistance at $534–$544, and a failure at the 200-day average ($519.50) opens a move toward $495–$508.
This is educational analysis and not financial advice.