AAPL 20-day bearish forecast — Nov 1, 2026
- Bias: Bearish
- Timeframe: 20 days (made Nov 1, 2026, target date Nov 20, 2026)
- Price at analysis: $344.63
- Price target: $338.50
- Expected range: $327.00 – $359.00
- Result: Pending — graded after the close on Nov 20, 2026
Get a free AI analysis of AAPL today
Analysis
TECHNICAL INDICATORS
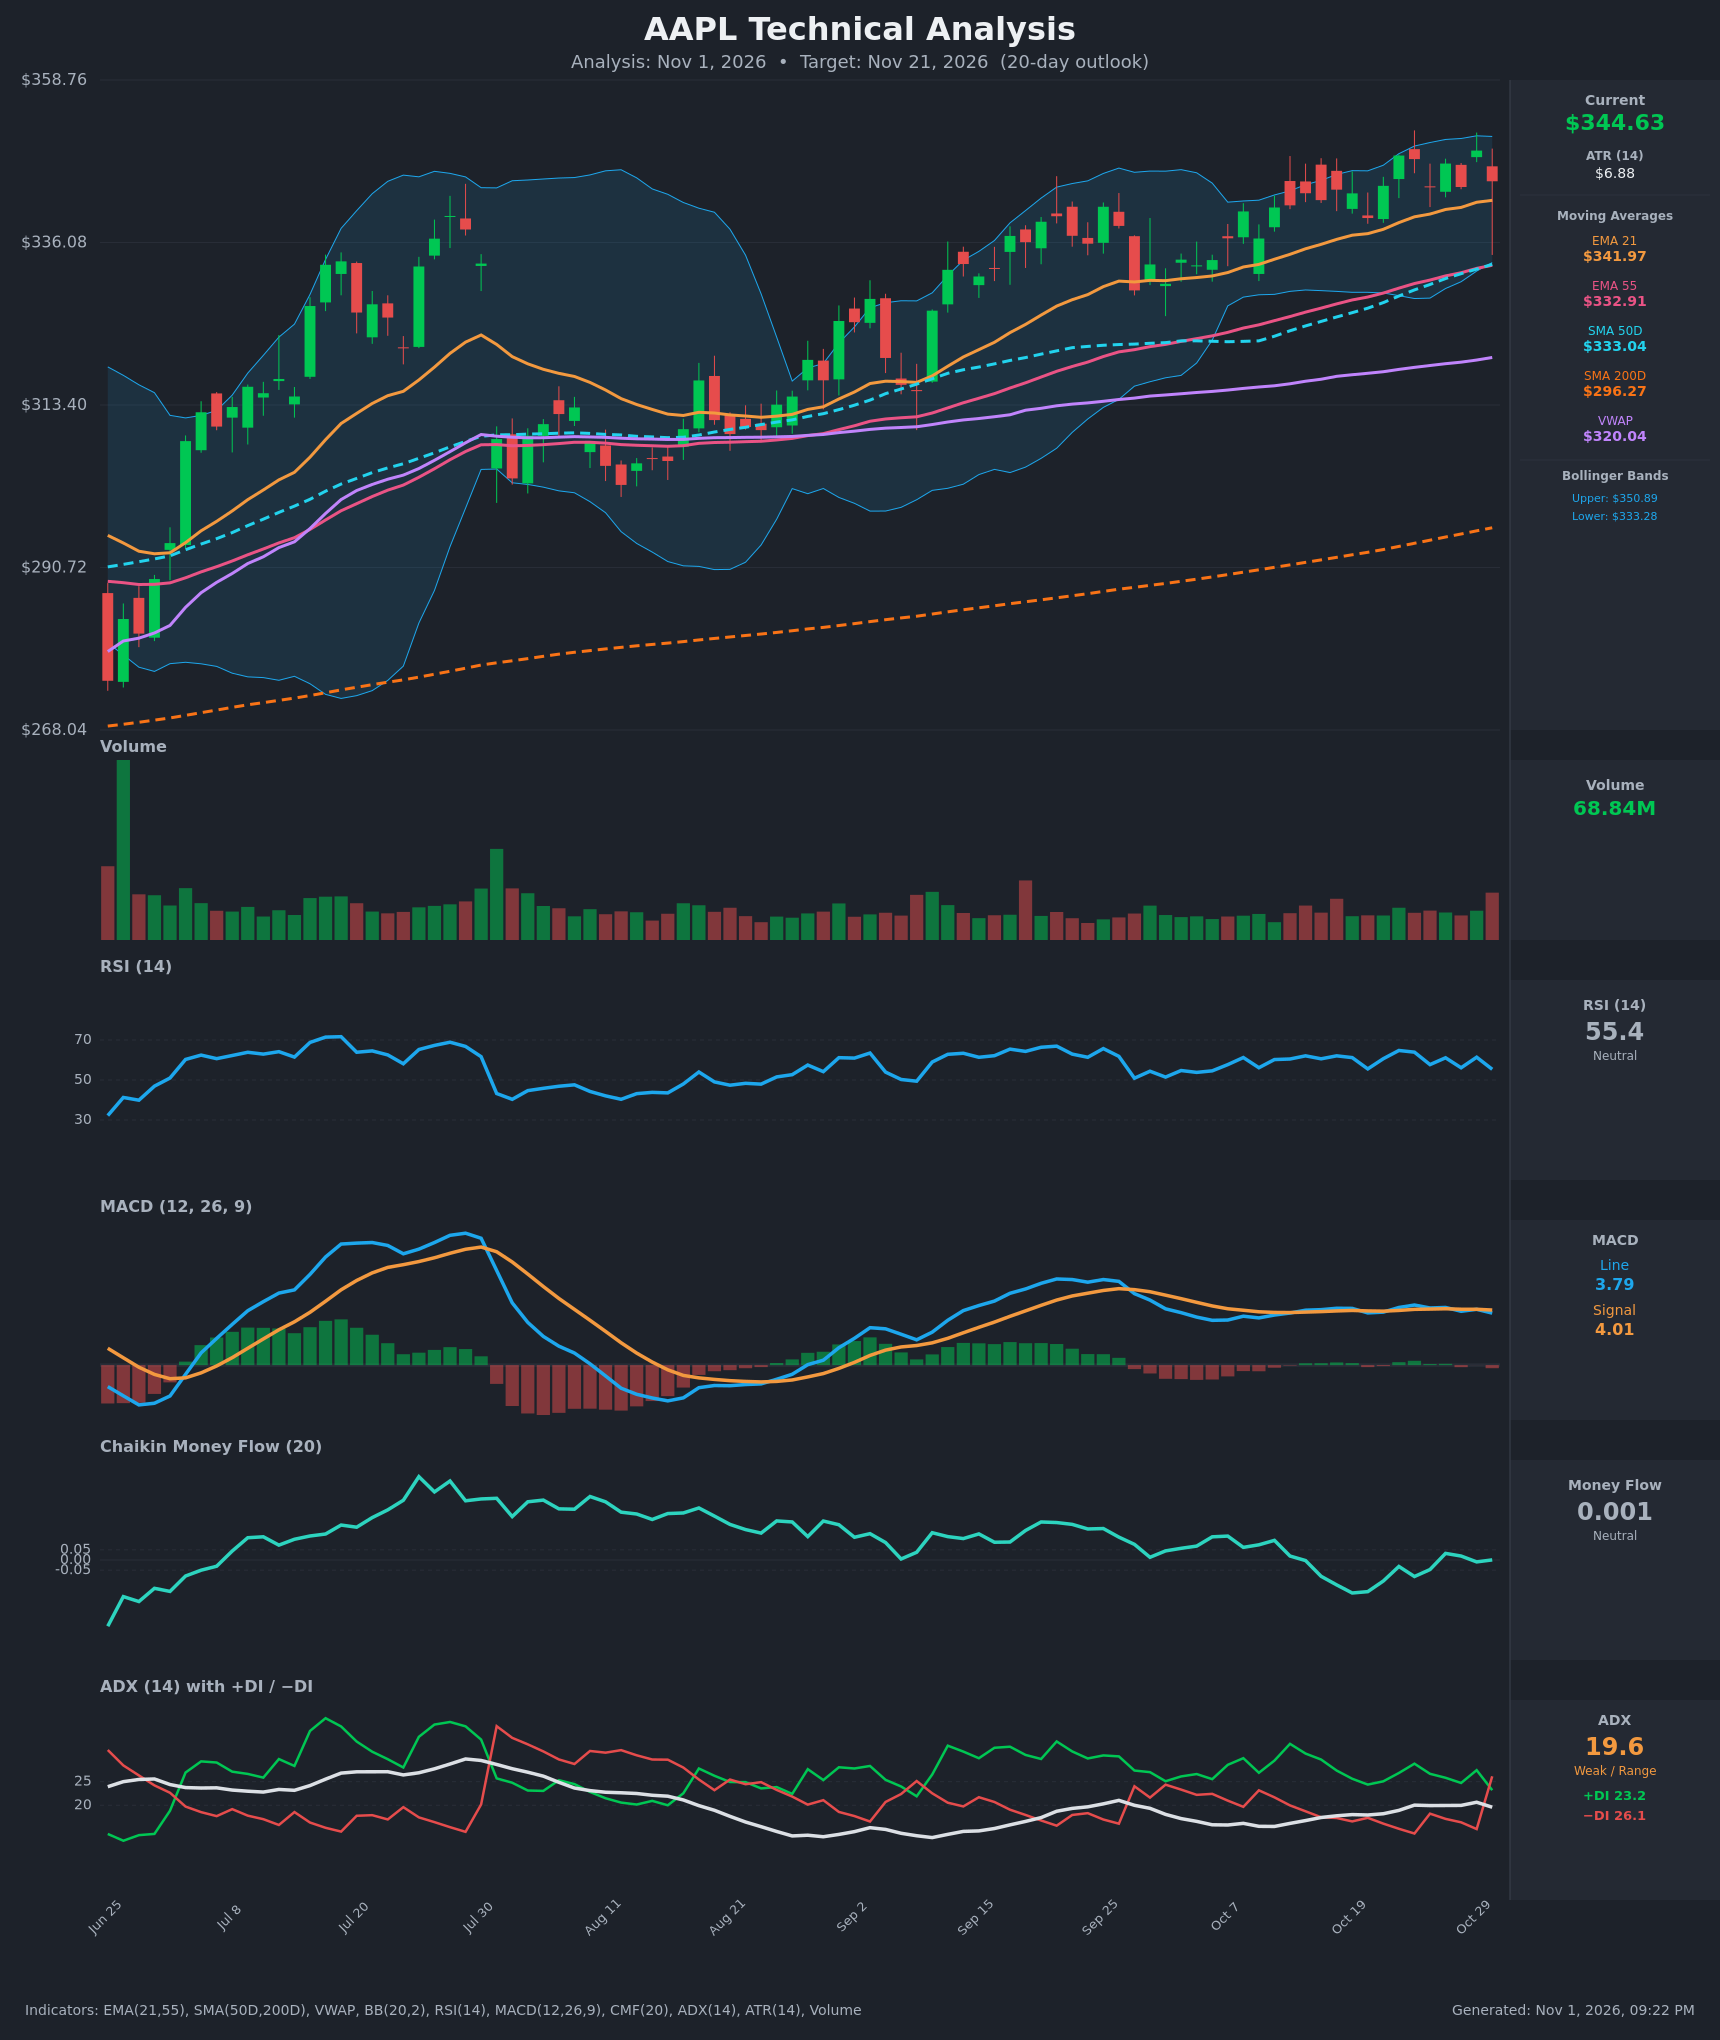
- RSI (14): 55.35, down from 64.8 on Oct 22 and back near the mid-line. It has made lower highs (61.4 on Oct 29) while price printed a new high at $348.91, which is mild momentum fade. It is not overbought or oversold. [Neutral]
- 20 EMA: The 21 EMA is $341.97 and price is only 0.8% above it. It has been support throughout October and is the first level to watch. EMA21 is above EMA55 ($332.91), so the trend structure is intact, but price is no longer extending away from it. [Neutral]
- MACD: The line (3.79) has crossed below the signal (4.01), a fresh bearish crossover on Oct 30. The histogram is slightly negative and flat, and the line is well below its July peak. Momentum is flat to weakening. [Bearish]
- Bollinger Bands (20): Upper $350.89, lower $333.28, mid about $342. Price rejected near the upper band on Oct 29 ($348.91) and closed at $344.63 in the upper half. The bands are narrow, which fits a consolidation. A mean-reversion move toward the midline or lower band is more likely than a band-walk. [Neutral]
- CMF (20): 0.001, inside the neutral band (±0.05). It has drifted from +0.096 on Oct 12 to roughly zero while price rose, so buying pressure is not confirming the new highs. [Neutral]
- ADX (14): 19.6 (weak, range-bound), with −DI (26.1) now above +DI (23.2). The DI flip on Oct 30 is a bearish crossover after weeks of +DI dominance. With ADX below 20 it signals a lack of trend more than a new downtrend. [Weak Trend, bearish tilt]
- Volume: 68.84M on the latest bar, which is red, and one of the heavier recent bars. Heavy volume on a down close after a rejection at $349 suggests some distribution. [Mildly Bearish]
DIVERGENCES & TRENDS
- Bearish divergence: price made a higher high on Oct 29 ($348.91), while RSI peaked at 64.8 on Oct 22 and MACD stayed capped around 4.0–4.4. CMF also faded from +0.096 to about 0 over the same period.
- Crossovers: MACD turned bearish on Oct 30, and −DI crossed above +DI on the same day. Both fired together, which adds weight.
- Long-term trend:
- Price is above SMA200D ($296.27), and SMA50D ($333.04) is far above SMA200D, so the golden cross is long established.
- EMA21 is above EMA55, and price is above VWAP ($320.04).
- The primary trend is up, but price is extended: 16% above SMA200D and 7.7% above VWAP.
- Short-term: AAPL has been stuck between about $339.50 and $349 for roughly two weeks. The advance has stalled, and ADX under 20 supports that.
CHART PATTERNS
- Triple-top / range at highs: The highs at $348.22 (Oct 22), $347.10 (Oct 27) and $348.91 (Oct 29) are nearly equal, with a neckline around $339.50–$340. This resembles a Bearish Triple Top (or Double Top) in a loose form. A close below $339.50 would project a measured move of about $9–10 down, to roughly $330, near the SMA50D/EMA55 cluster at $333.
- Counter-view: The prior uptrend is strong, and a hold above EMA21 with a break above $349 would instead turn this into a bullish continuation (flag/ascending consolidation) toward $356–$360.
- The pattern is not confirmed until the neckline breaks.
POTENTIAL SCENARIOS
- Scenario 1: Bearish Pullback to the Moving Average Cluster — Momentum signals (MACD cross, DI flip, fading CMF/RSI) and the failure at $349 lead to a neckline break and a mean-reversion pullback. Trigger: daily close below $339.50 (and below EMA21 at $341.97). Target: $333–$338, with an extension to about $330. Invalidation: daily close above $349.00. (45% probability)
- Scenario 2: Bullish Breakout Continuation — Buyers defend EMA21 and the long-term uptrend resumes. Trigger: close above $349 on rising volume, with MACD re-crossing above its signal. Target: $356–$360. Invalidation: close below $339.50. (35% probability)
- Scenario 3: Neutral Range Persistence — Price chops between $339.50 and $349 with weak ADX. Trigger: no close outside the range. Target: $340–$348. Invalidation: a decisive close outside the range. (20% probability)
PRICE TARGETS
Range width check: $359.00 − $327.00 = $32.00, which is 9.3% of $344.63. That fits the 14–21 day guidance of 8–12%.
- Target Price: $338.50 (20-day, about −1.8%)
- Expected Range: $327.00 to $359.00
- Key Levels: Support at $333.04 (SMA50D, EMA55 and lower Bollinger Band cluster), Resistance at $349.00 (recent swing high, just under the upper Bollinger Band at $350.89)
OVERALL BIAS
OVERALL BIAS: BEARISH - A fresh MACD bearish crossover and −DI taking over from +DI, together with price/RSI/CMF divergence and a triple-top-like rejection at $349 on heavy red volume, favor a pullback toward the $333–$338 moving-average cluster. The long-term uptrend is intact and ADX is weak, so conviction is modest.
This is educational analysis and not financial advice.