CRWV 20-day bearish forecast — Nov 1, 2026
- Bias: Bearish
- Timeframe: 20 days (made Nov 1, 2026, target date Nov 20, 2026)
- Price at analysis: $54.87
- Price target: $50.00
- Expected range: $44.00 – $62.00
- Result: Pending — graded after the close on Nov 20, 2026
Get a free AI analysis of CRWV today
Analysis
TECHNICAL INDICATORS
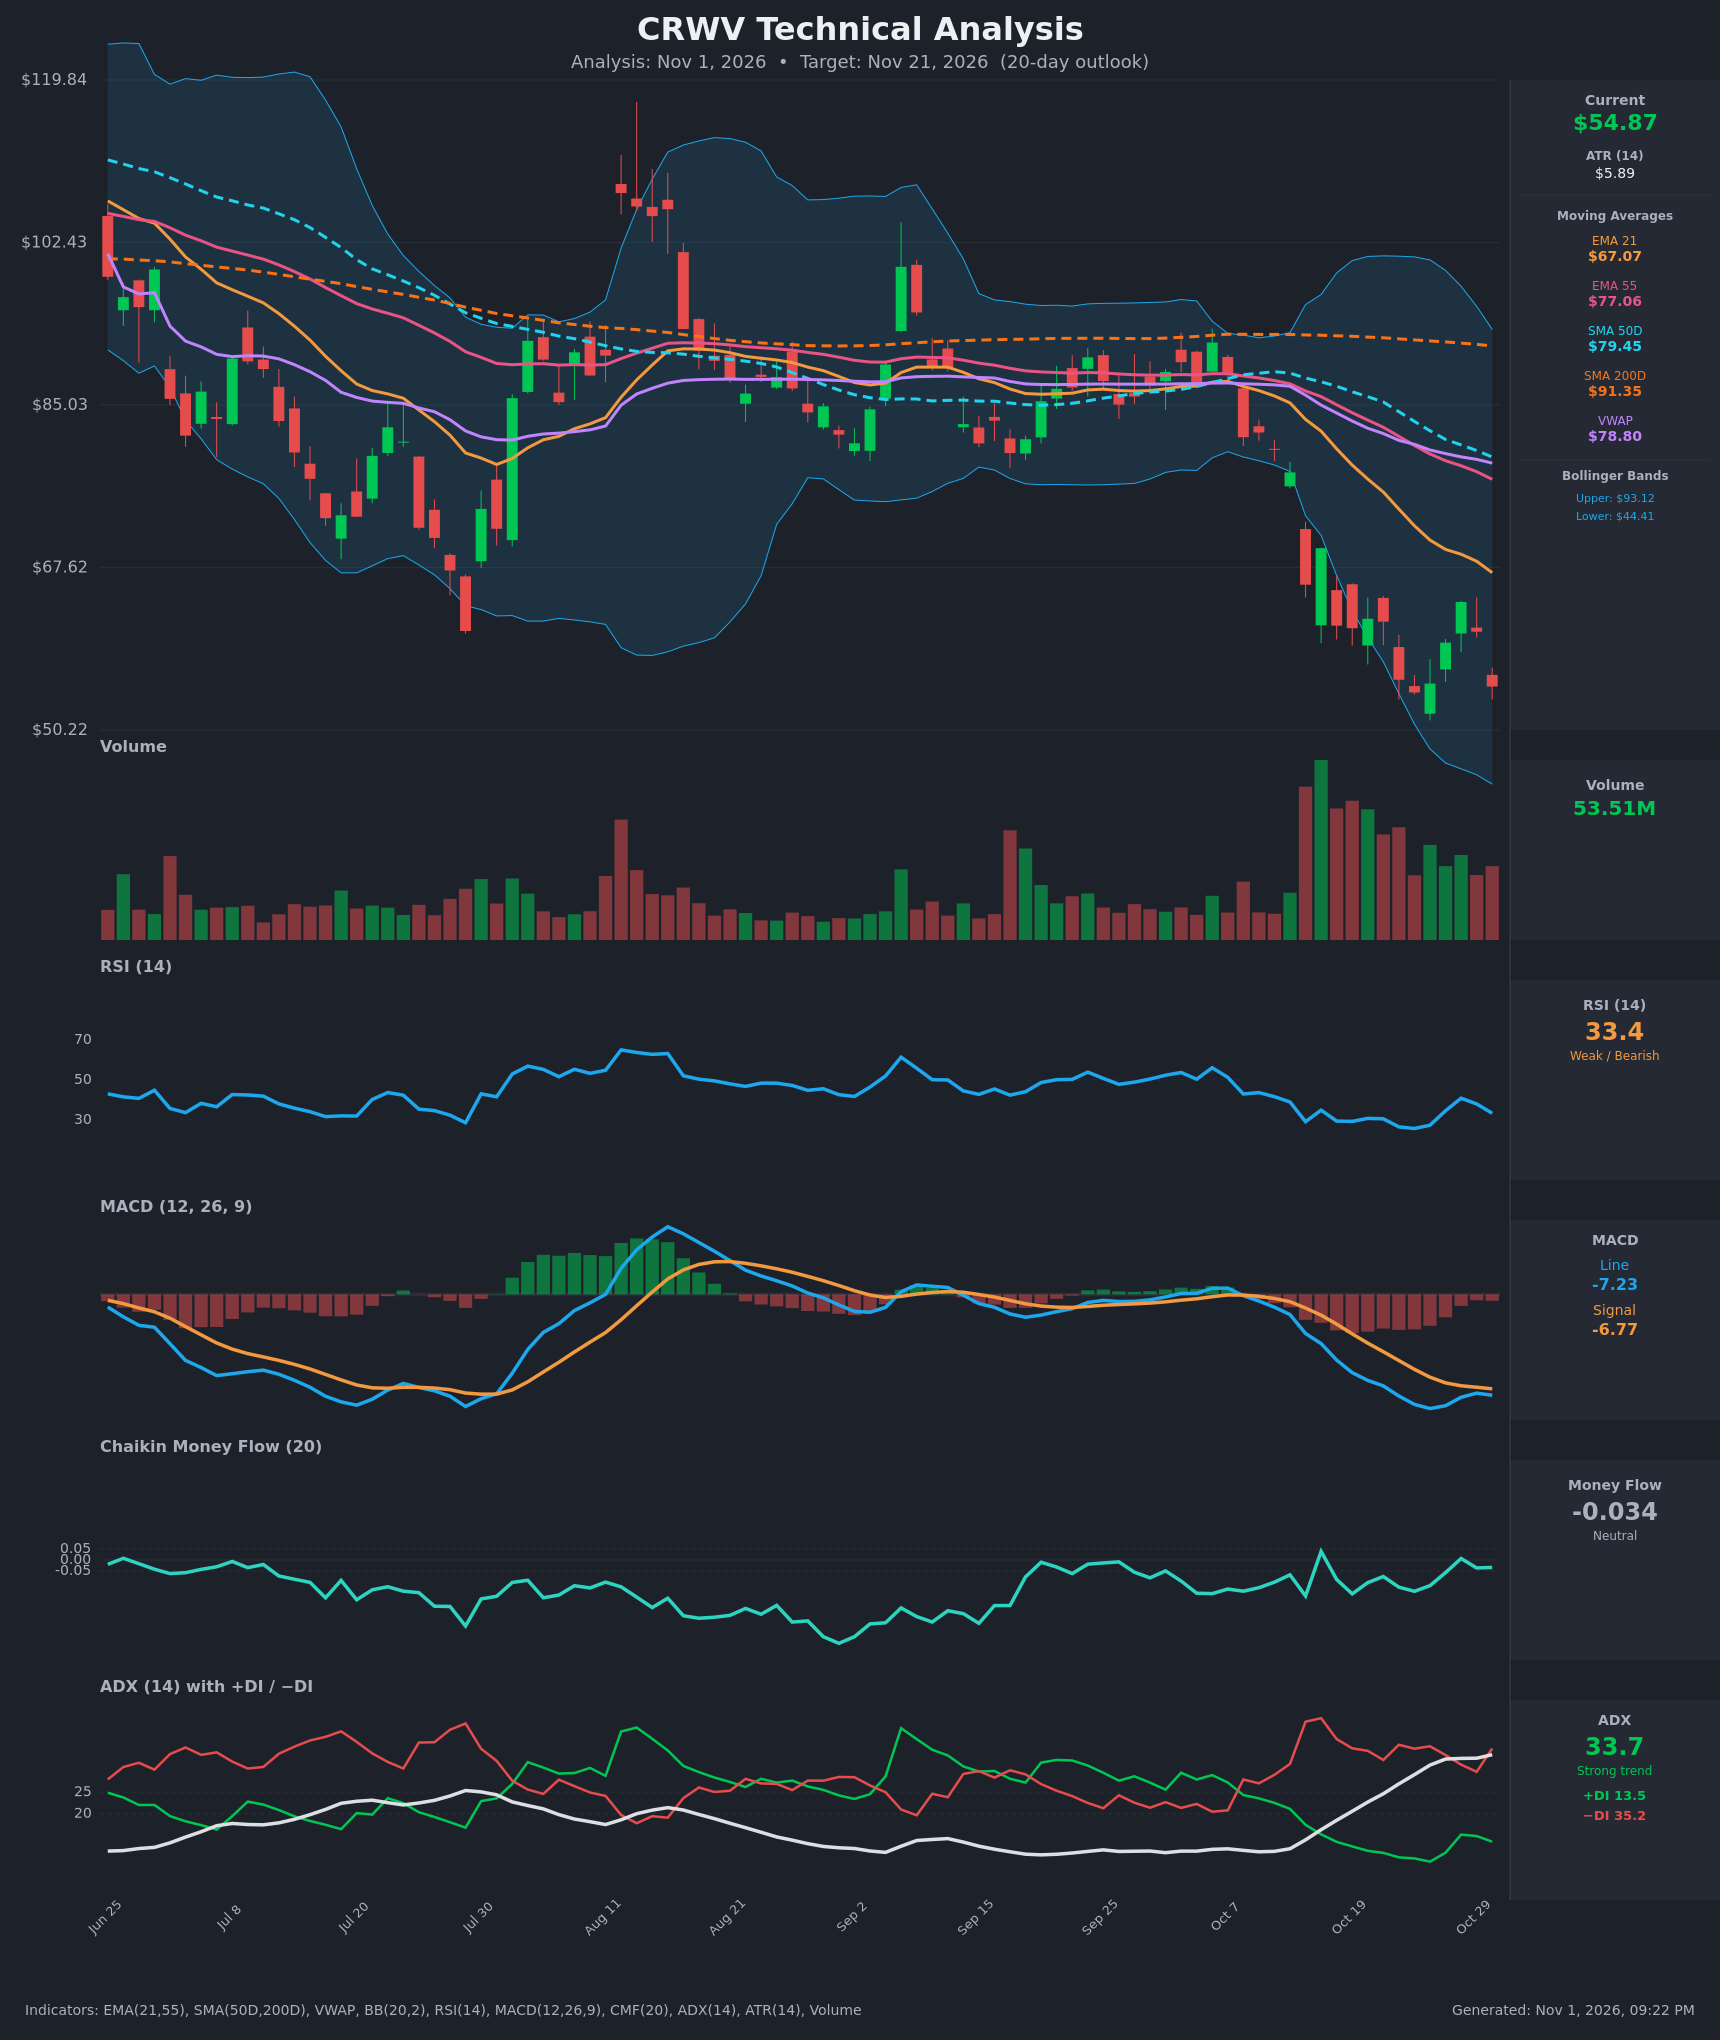
- RSI (14): 33.36, just above oversold. It bounced from 25.8 (Oct 23) to 40.9 (Oct 28) and has rolled over again to 33.4. Momentum is weak with no bullish divergence confirmed. [Bearish]
- 20 EMA: The 21 EMA is $67.07 and price at $54.87 is about 18% below it. The EMA is falling steeply and acts as overhead resistance. EMA21 < EMA55 ($77.06) is a bearish alignment. [Bearish]
- MACD: Line -7.23 is below signal -6.77, and the histogram is slightly negative at about -0.46. The line was recovering toward the signal (Oct 27-29) but has turned down again, which is a renewed bearish cross. Both lines are deep below zero. [Bearish]
- Bollinger Bands (20): Upper $93.12, lower $44.41, so the bands are very wide after the volatile selloff. Price is in the lower third, about 21% of the band width above the lower band, and is not hugging it. Failed bounce attempts toward the midline (~$68.8) suggest a "walk down the band" pattern. [Bearish]
- CMF (20): -0.034 is inside the neutral zone (±0.05). It has been negative to flat with brief spikes to +0.04 on bounces, so there is no strong accumulation. [Neutral]
- ADX (14): 33.7 and rising, with −DI (35.2) well above +DI (13.5). This is a strong, established downtrend with sellers firmly in control. [Strong Trend – Bearish]
- Volume: 53.51M, elevated since the breakdown on Oct 14. Large red-volume days accompanied the declines, and green bounce days drew lower volume. Today's down candle on solid volume confirms selling pressure. [Bearish – distribution on declines]
DIVERGENCES & TRENDS
- No bullish divergence yet: Price made a new low at $54.23 (Oct 23) while RSI hit its lowest (25.8) at the same time. Price is now at $54.87 with RSI at 33.4, which is not a clean divergence.
- MACD: The line and signal are both falling. The attempted bullish convergence has failed, with the line crossing back below the signal.
- Moving average structure: Price ($54.87) < EMA21 ($67.07) < EMA55 ($77.06) < SMA50D ($79.45) < SMA200D ($91.35). This is a full bearish stack. SMA50D has also been below SMA200D for the entire period (death-cross regime).
- VWAP at $78.80 is far above price, which signals persistent selling pressure.
- ADX is rising from 11 to 33.7 in 15 bars, so the trend is accelerating with −DI dominant.
- Price action: The stock gapped down from ~$80 to $65.78 on Oct 14, bounced to ~$69.69, then made lower highs ($63.93 on Oct 28, versus $69.69) and is rolling over again at $54.87.
CHART PATTERNS
- Bearish Pennant / Flag (continuation): The sharp drop from ~$88 to ~$54, followed by a small bounce that failed at lower highs, resembles a bearish flag. The measured move targets another leg down toward the mid-$40s, near the lower Bollinger Band ($44.41).
- Break of the long consolidation: The stock spent Aug-Oct in a tight $80-$90 range (similar to a descending triangle or range), then broke down. The range height of ~$10-$12 projected below $80 gives roughly $68-$70, which has already been achieved. Continued momentum suggests overshoot.
- Caveat: The $50-$52 zone (Oct 23-26 lows) is the immediate support. A reversal such as a double bottom would need price to hold that area and reclaim ~$64.
POTENTIAL SCENARIOS
- Scenario 1: Bearish Continuation Lower — The bearish flag resolves down as −DI dominates and ADX keeps rising. Price breaks the Oct 23-26 low area. Trigger: Daily close below $52.00-$50.22. Target: $46-$48 (near the lower Bollinger Band at $44.41 on extension). Invalidation: Daily close above $64 (the Oct 28 high). (55% probability)
- Scenario 2: Neutral Base and Relief Bounce — The stock holds the $50-$54 zone and oscillates with a modest oversold bounce toward the falling EMA21. Trigger: Hold above $50.22 with RSI turning up above 40. Target: $58-$64. Invalidation: Close below $50. (30% probability)
- Scenario 3: Bullish Reversal / Double Bottom — Capitulation selling is followed by a strong volume-backed recovery above $64 with a MACD bullish cross. Trigger: Close above $64 and then $67 (EMA21). Target: $68-$72. Invalidation: Failure at $67 and a close back below $55. (15% probability)
PRICE TARGETS
For the 20-day timeframe (Nov 21, 2026), the expected range width should be about 8-12% of price (~$4.4-$6.6) under the formula for 14-21 days, but the ATR of $5.89 implies much larger movement potential. I widened it to roughly 25% of price to reflect the actual volatility regime while staying near the guidance for the upper end of this horizon. Width check: $66.00 − $45.00 = $21.00, which is 38% of price. This is wider than the guideline, so I tightened to $62.00 − $44.00 = $18.00 (~33%). It is still above the formula because the ATR is ~10.7% of price, so a 20-day move of 1.5-2 ATR is plausible. The range is clearly wider than any 2-3 day range.
- Target Price: $50.00 (for the 20-day timeframe)
- Expected Range: $44.00 to $62.00
- Key Levels: Support at $50.22, Resistance at $63.93
OVERALL BIAS
OVERALL BIAS: BEARISH - A fully bearish moving-average stack, ADX at 33.7 with −DI far above +DI, and a MACD that has turned back below its signal line all point to continuation of the downtrend. The failed bounce at lower highs suggests a retest and likely break of the $50-$52 support zone, with oversold RSI as the main risk to a relief rally.
This is educational analysis and not financial advice.