AMZN 20-day bearish forecast — Nov 1, 2026
- Bias: Bearish
- Timeframe: 20 days (made Nov 1, 2026, target date Nov 20, 2026)
- Price at analysis: $240.35
- Price target: $235.50
- Expected range: $223.50 – $250.00
- Result: Pending — graded after the close on Nov 20, 2026
Get a free AI analysis of AMZN today
Analysis
TECHNICAL INDICATORS
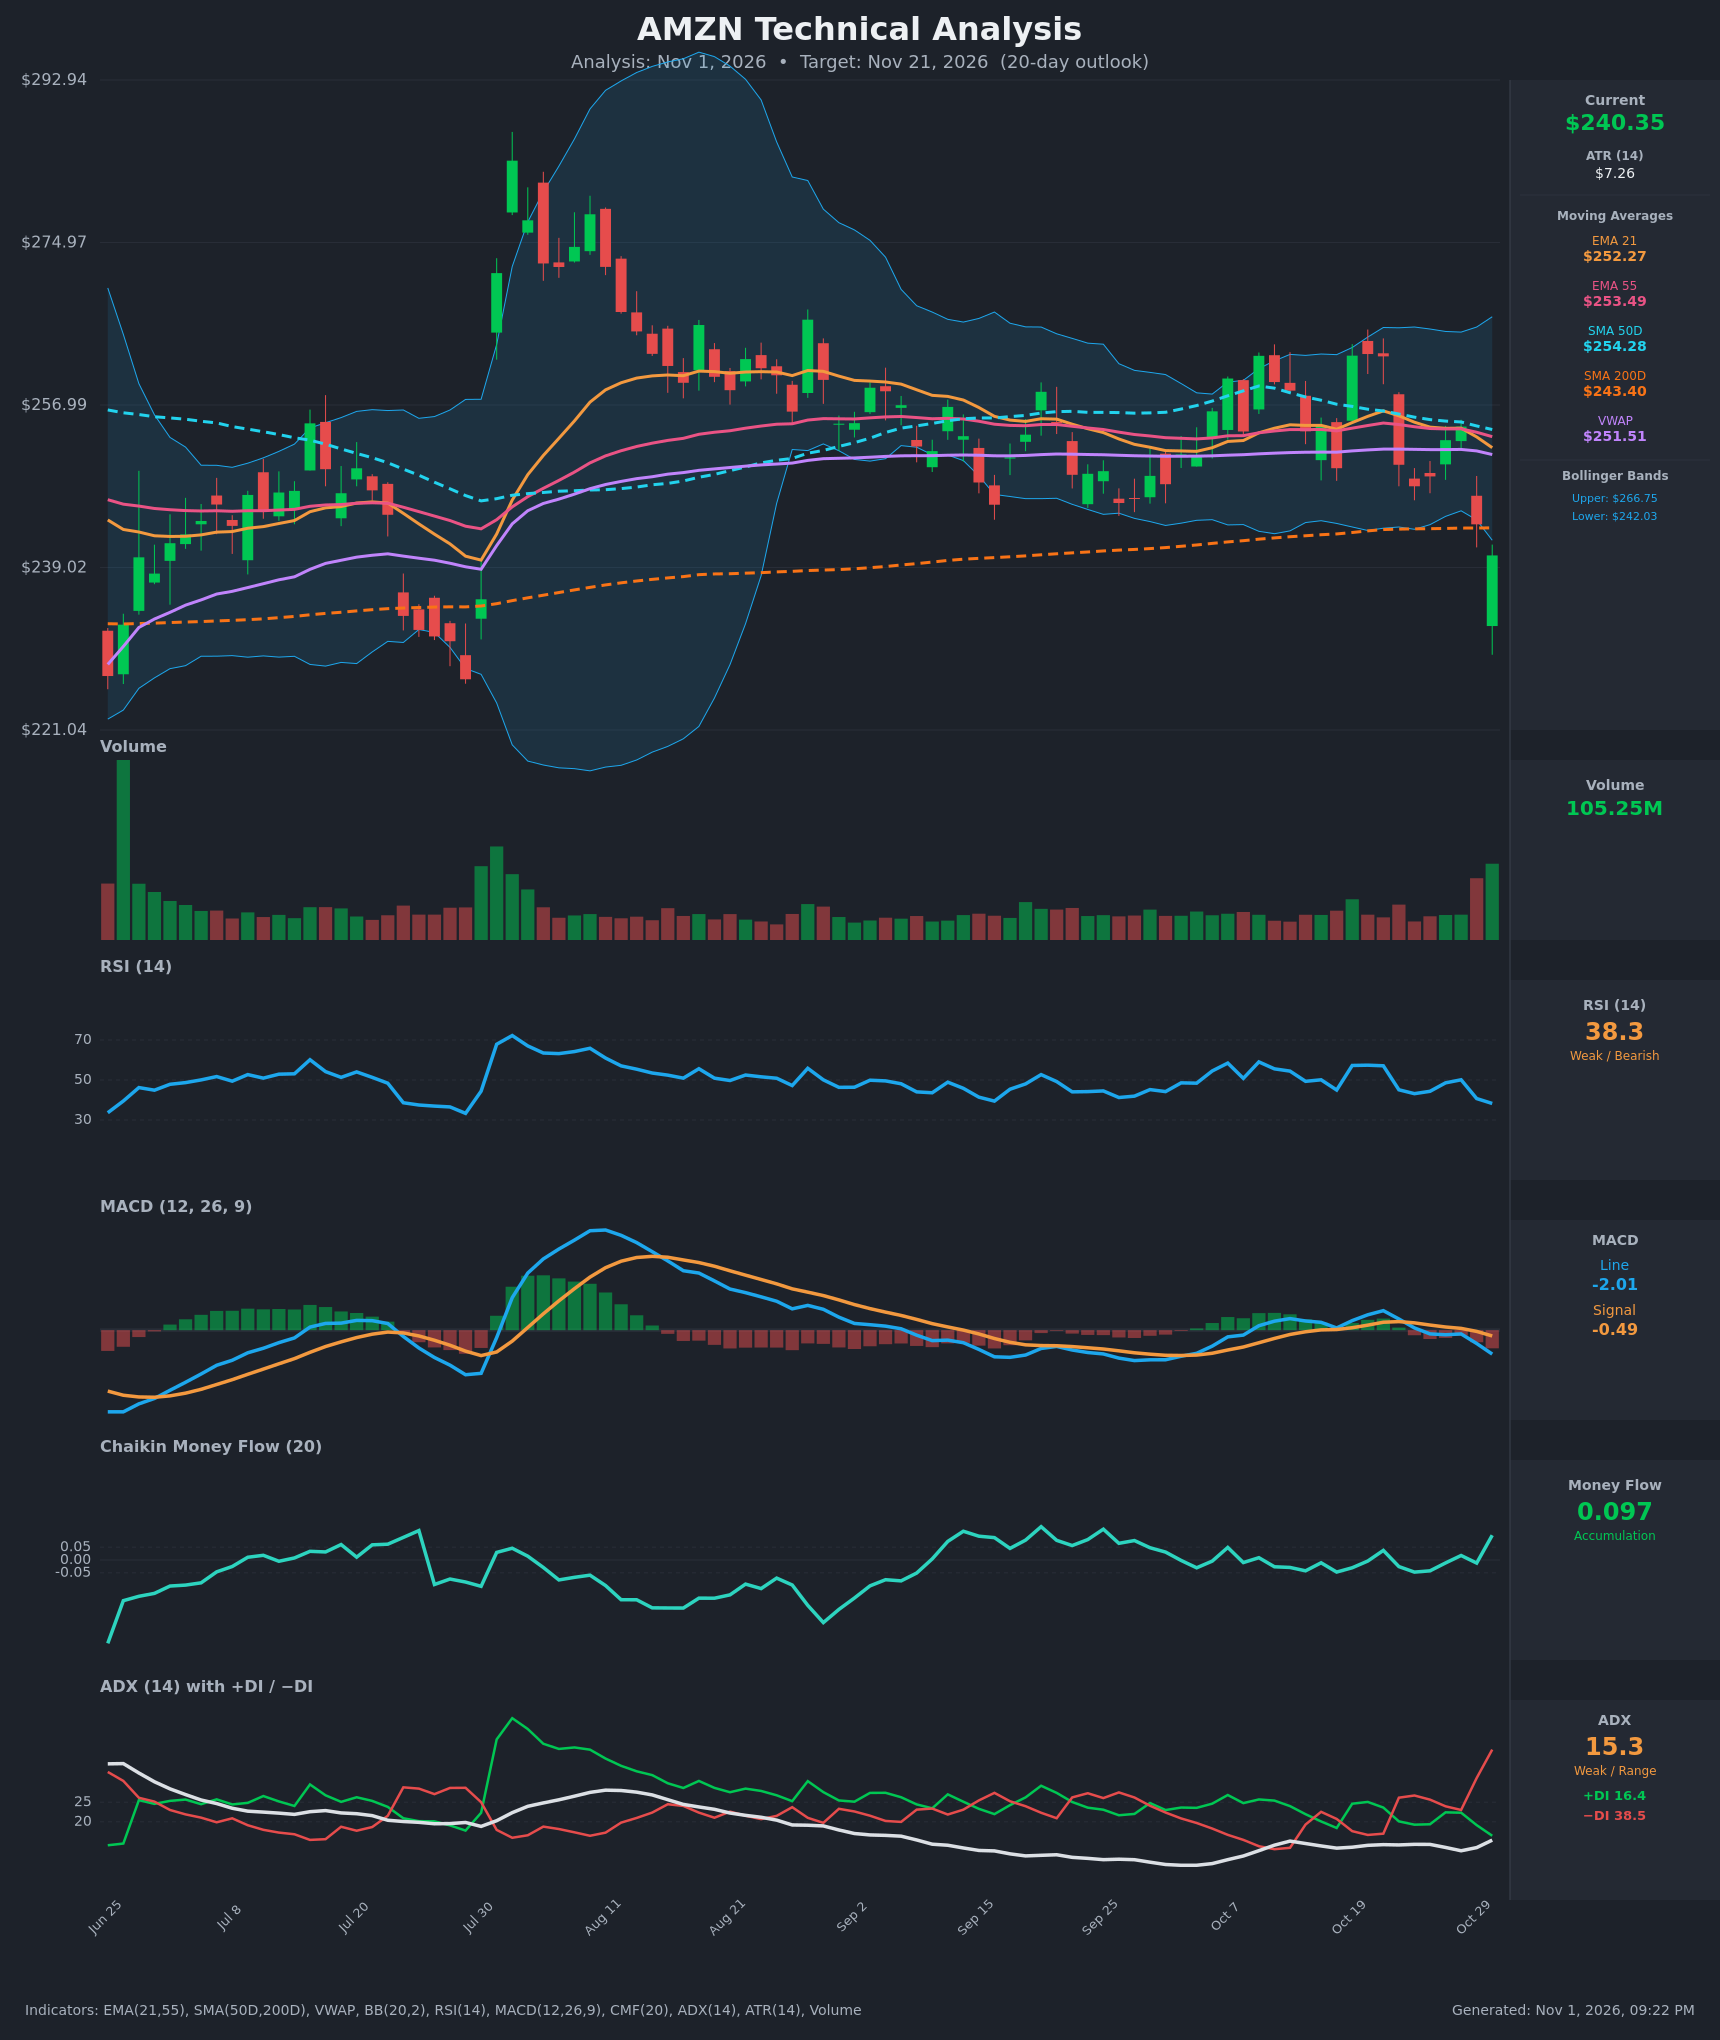
- RSI (14): 38.26, down from about 50 on Oct 28 and 57 on Oct 19-21. It is below the midline and approaching oversold (30) but not there yet, so momentum is still falling. [Bearish]
- 20 EMA: The data gives EMA 21 at $252.27 (EMA 55 at $253.49). Price at $240.35 is about 4.7% below it, and the EMA is rolling over and now sits below the EMA 55 (a fresh bearish crossover on Oct 29-30). The EMAs act as overhead resistance. [Bearish]
- MACD: Line -2.01 is below signal -0.49, and both are falling. The line crossed below the signal on Oct 29 and the histogram is widening negative, so bearish momentum is accelerating. [Bearish]
- Bollinger Bands (20): Upper $266.75, lower $242.03. Price at $240.35 is just below the lower band, an extension that signals strong selling pressure. It also raises the odds of a snap-back toward the mid-band (~$254), but price can "walk the band" in a downtrend. [Bearish]
- CMF (20): +0.097, a rise from -0.012 yesterday, and above the +0.05 accumulation threshold. Heavy volume with closes near the session highs suggests dip buying. This is the main bullish counterpoint, but the reading is a one-day jump and still inconsistent with the prior two weeks of slightly negative values. [Accumulation]
- ADX (14): 15.3 with −DI 38.5 well above +DI 16.4. The trend is weak by ADX, but the DI spread is wide and −DI is rising sharply (bears in control). ADX is starting to turn up from the low teens, which hints at a developing downtrend. [Weak Trend, bearish direction]
- Volume: 105.25M, the highest bar in months apart from the June spike and the late-July surge. High volume on a breakdown below the SMA200 confirms the move, though the green volume bar and long lower wick show some buyers stepping in. [Heavy volume, selling with partial absorption]
Other levels:
- SMA 50/200: SMA50D is $254.28 and SMA200D is $243.40, so there is no death cross yet and the SMA50 is still above the SMA200. Price has just closed below the SMA200 (long-term support lost). [Bearish]
- VWAP: $251.51, about 4.4% above price, so sellers dominate. [Bearish]
DIVERGENCES & TRENDS
- CMF vs price: CMF is rising (+0.097) while price makes a new low. This is a short-term bullish divergence that points to possible absorption or a bounce, but it is a single-bar signal and needs confirmation.
- RSI/MACD: Both are confirming the lower price, with no bullish divergence. The MACD bearish crossover (Oct 29) and EMA21 crossing below EMA55 are fresh and confirmed.
- Trend: Since August, price has chopped between roughly $245 and $265 with lower-high tendencies. The break below the range floor and the SMA200 with a −DI spike resolves the consolidation to the downside.
- DI: −DI crossed above +DI on Oct 22 and has widened since. Price is below every moving average except none (all overhead).
CHART PATTERNS
- No pattern from the reference is perfect. The best fit is a range breakdown similar to the Bearish Triple Top / Double Top family: a multi-week range with resistance near $262-266 (tested Oct 19-21 and earlier) that has now broken beneath the range floor (~$245) and the SMA200.
- Measured move: the range height is about $19 (~$264 less ~$245), which projects to about $226 on a full breakdown. A more conservative 20-day target is the $230-236 zone.
- The long lower wick on the last candle and the CMF jump suggest a possible retest of the broken $243-245 area before any continuation lower, and this would be the "bearish retest" version of the pattern.
POTENTIAL SCENARIOS
- Scenario 1: Bearish Breakdown Continuation — Price has lost the SMA200 and the lower Bollinger Band with expanding −DI and MACD momentum. A weak bounce into $243-246 fails, and price drifts toward the $230 area. Trigger: failure to reclaim $243.40 and a daily close below $238. Target: $230-$233 (extension to $226 if momentum accelerates). Invalidation: daily close above $246 (the SMA200 and the lower BB reclaimed). (50% probability)
- Scenario 2: Bullish Oversold Mean-Reversion Bounce — Price is below the lower band with RSI near 38, a CMF accumulation spike and a high-volume reversal-type bar. A relief rally back toward the VWAP/EMAs is possible. Trigger: close above $243.40-$246 on volume. Target: $251-$254 (EMA21/VWAP/SMA50). Invalidation: close below $236. (32% probability)
- Scenario 3: Neutral Choppy Basing — Price oscillates around the SMA200 between about $234 and $248 while ADX stays weak. Trigger: no decisive close beyond $234 or $248. Target: $238-$244. Invalidation: a daily close outside this band. (18% probability)
PRICE TARGETS
- Target Price: $235.50 (20-day horizon, Nov 21, 2026)
- Expected Range: $223.50 to $250.00 (width $26.50, about 11% of the current price, consistent with the 14-21 day guidance of 8-12%)
- Key Levels: Support at $230.00, Resistance at $243.40
OVERALL BIAS
OVERALL BIAS: BEARISH - Price is below every major moving average and VWAP, has lost the SMA200, and sits under the lower Bollinger Band. MACD and EMA crossovers are bearish and −DI (38.5) dominates +DI (16.4) on heavy volume. The CMF spike is the main counter-signal and makes a relief bounce toward $243-246 likely, but the bounce should meet resistance, leaving the drift toward $235 as the better-supported path.
This is educational analysis and not financial advice.