DELL 20-day bearish forecast — Nov 1, 2026
- Bias: Bearish
- Timeframe: 20 days (made Nov 1, 2026, target date Nov 20, 2026)
- Price at analysis: $424.30
- Price target: $410.00
- Expected range: $385.00 – $435.00
- Result: Pending — graded after the close on Nov 20, 2026
Get a free AI analysis of DELL today
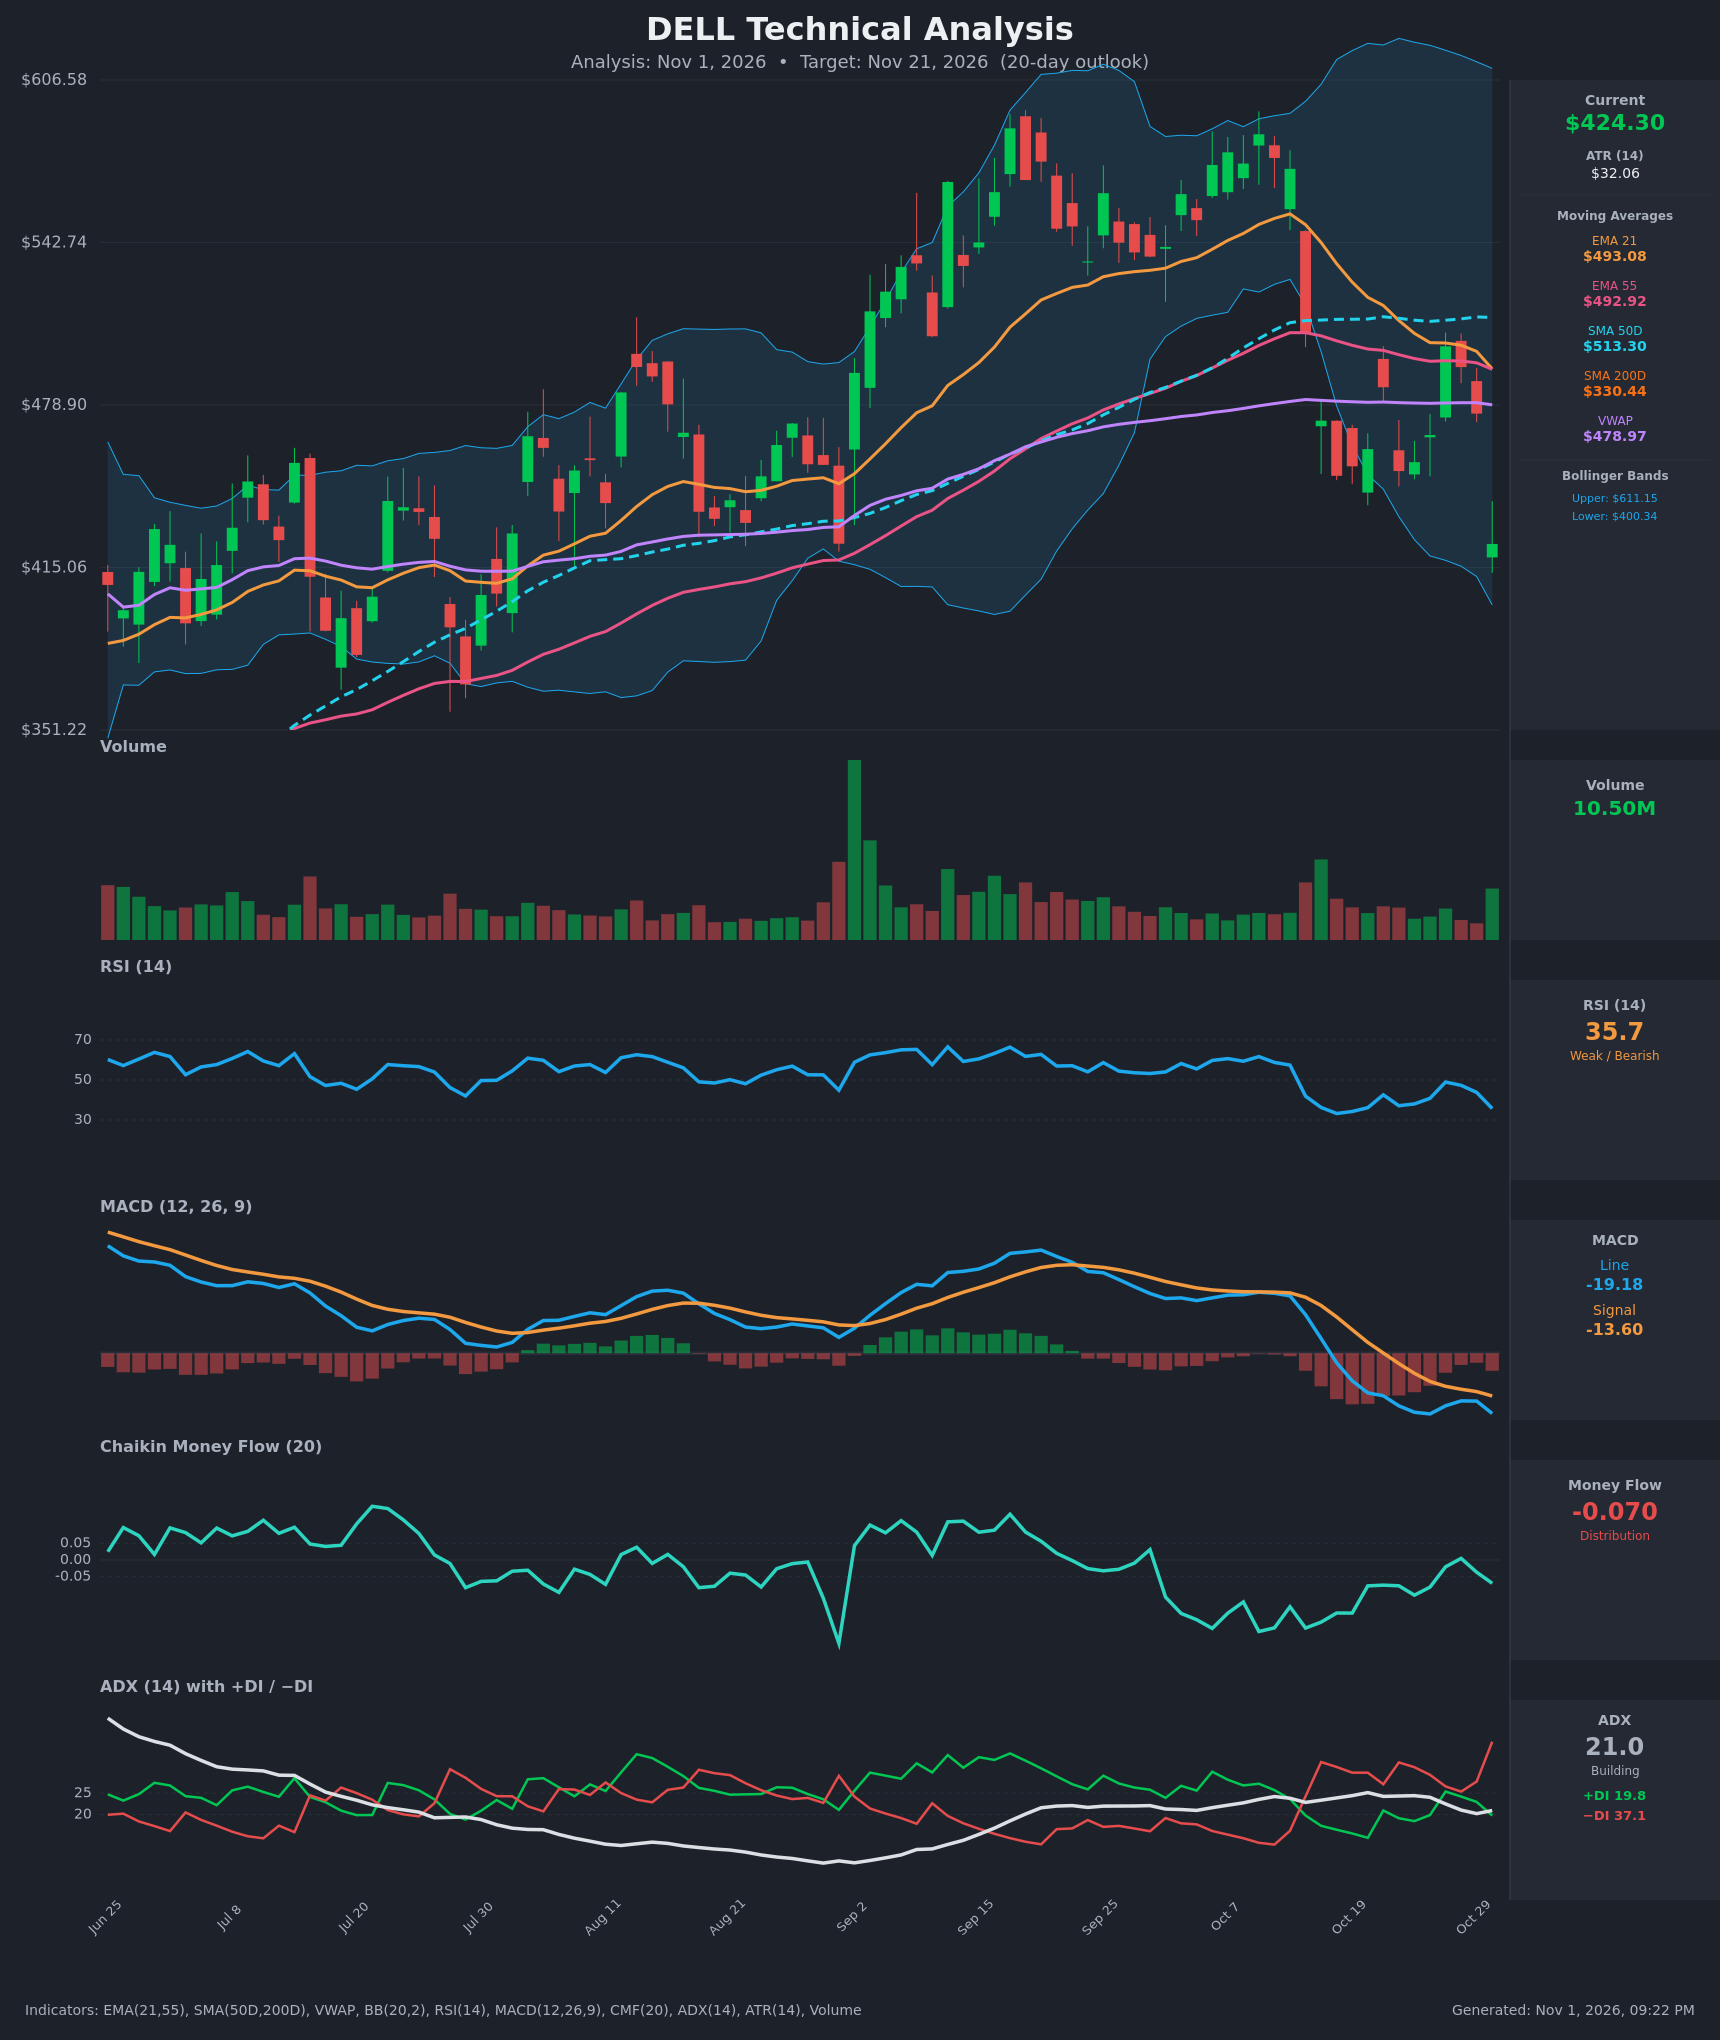
Analysis
TECHNICAL INDICATORS
- RSI (14): 35.74, falling sharply from 49.0 on Oct 27. It is near oversold but not there yet, and it has room to fall toward 30. Momentum is bearish, though the reading is stretched. [Bearish]
- 20 EMA: The 21 EMA is at $493.08 and price at $424.30 is about 14% below it. The EMA has rolled over from $553 and now acts as heavy overhead resistance. EMA21 ($493.08) is converging with EMA55 ($492.92) and is about to cross below it, which would be a bearish crossover. [Bearish]
- MACD: The line is at -19.18 and the signal at -13.60. The line crossed below the signal around Oct 16 and is making new lows. The histogram is negative and widening again after a brief narrowing. [Bearish]
- Bollinger Bands (20): Upper is $611.15, lower is $400.34, and the mid-band is about $505. Price is in the lower quarter of the bands, about $24 above the lower band. The bands are wide after the October spike and are now turning down. A walk along or break of the lower band is possible, but a bounce off it is also common. [Bearish]
- CMF (20): -0.070, below the -0.05 threshold. It has been mostly negative for weeks and has slipped back from a brief touch of positive on Oct 28. This is persistent distribution. [Distribution]
- ADX (14): 21.0, rising slightly from 20.2, with −DI at 37.1 well above +DI at 19.8. The trend is not yet "strong" (<25), but the directional spread is large and bears control. A rising ADX would confirm the downtrend. [Weak-to-Building Trend, Bearish direction]
- Volume: 10.50M. The latest bar is among the heavier of the recent sessions and came on a 10.8% one-day drop ($475.51 to $424.30). Heavy volume on a breakdown suggests real selling pressure rather than a drift lower. It also leaves some chance of short-term capitulation. [Bearish / Distribution]
DIVERGENCES & TRENDS
- Price vs. RSI: Price closed at $424.30, well below the Oct 16 low of $451.09, but RSI is 35.7 versus 33.2 then. That is a mild potential bullish divergence, though RSI has not reached oversold and it is not confirmed.
- MACD: The line is at a new low (-19.18) versus -19.31 on Oct 26 and has not diverged. Momentum is still deteriorating.
- Moving averages: Price is below EMA21, EMA55, SMA50 ($513.30) and VWAP ($478.97). It is still well above SMA200 ($330.44), so the long-term uptrend is intact. There is no death cross, since SMA50 is far above SMA200, but SMA50 is flattening.
- EMA21/55: The gap has narrowed from +$47 on Oct 12 to +$0.16, so a bearish cross is imminent.
- DI: −DI has been above +DI since Oct 14 apart from a brief bounce, and the Oct 30 drop widened the spread to about 17 points.
- CMF: It is stuck below zero, consistent with the sustained selling.
CHART PATTERNS
- Price put in a blow-off top near $576 (Oct 12-13). It then fell sharply and formed a choppy $450-$500 consolidation, which resembles a Bearish Pennant/Flag continuation pattern. The Oct 30 break below that base to $424 is the downside resolution. The measured move (range of about $50 projected from the $450 break) points to roughly $400, near the lower Bollinger Band, with extension toward the $380 area.
- The October peak and lower highs ($576, then $502) also loosely resemble a Bearish Double Top / Head-and-Shoulders-style reversal, with the neckline around $450-$455 now broken. This is a looser fit and less reliable.
- The pattern read is bearish, and the broken $450-$455 zone is now resistance. The main counter-risk is a relief bounce back to that zone.
POTENTIAL SCENARIOS
- Scenario 1: Bearish Breakdown Continuation — Price extends the post-pennant breakdown, with the −DI-led trend and MACD pressure pushing it through the lower Bollinger Band. Trigger: daily close below $400. Target: $380-$400, with possible extension to about $370 (the July/August lows). Invalidation: daily close above $455. (50% probability)
- Scenario 2: Bullish Oversold Relief Bounce — A sharp 10.8% drop plus near-oversold RSI and a mild divergence invite a mean-reversion rally. Price retraces into the broken $450-$480 zone but fails below the EMA cluster near $493. Trigger: reclaim of $455 on rising volume. Target: $470-$490. Invalidation: close back below $400. (35% probability)
- Scenario 3: Neutral Basing Range — Price chops between roughly $400 and $450 as selling exhausts and ADX stays near 20. Trigger: several closes inside $400-$450 with RSI holding 30-45. Target: $415-$440. Invalidation: close outside $395-$460. (15% probability)
PRICE TARGETS
- Target Price: $410.00 (20-day, Nov 21, 2026)
- Expected Range: $385.00 to $435.00. The width is $50, or about 11.8% of the current price, in line with the 14-21 day guidance.
- Key Levels: Support at $400.34 (lower Bollinger Band), Resistance at $455.00 (broken base and prior support, now resistance)
OVERALL BIAS
OVERALL BIAS: BEARISH - Price is below EMA21/55, SMA50 and VWAP with MACD negative and widening, −DI dominant (37.1 vs 19.8), CMF showing distribution, and a high-volume breakdown from the $450-$500 base. Near-oversold RSI makes a relief bounce likely along the way, but the broken $450-$455 level should cap it and keep the path toward $400 and below.
This is educational analysis and not financial advice.