F 20-day bullish forecast — Nov 1, 2026
- Bias: Bullish
- Timeframe: 20 days (made Nov 1, 2026, target date Nov 20, 2026)
- Price at analysis: $12.25
- Price target: $12.65
- Expected range: $11.70 – $13.05
- Result: Pending — graded after the close on Nov 20, 2026
Get a free AI analysis of F today
Analysis
TECHNICAL INDICATORS
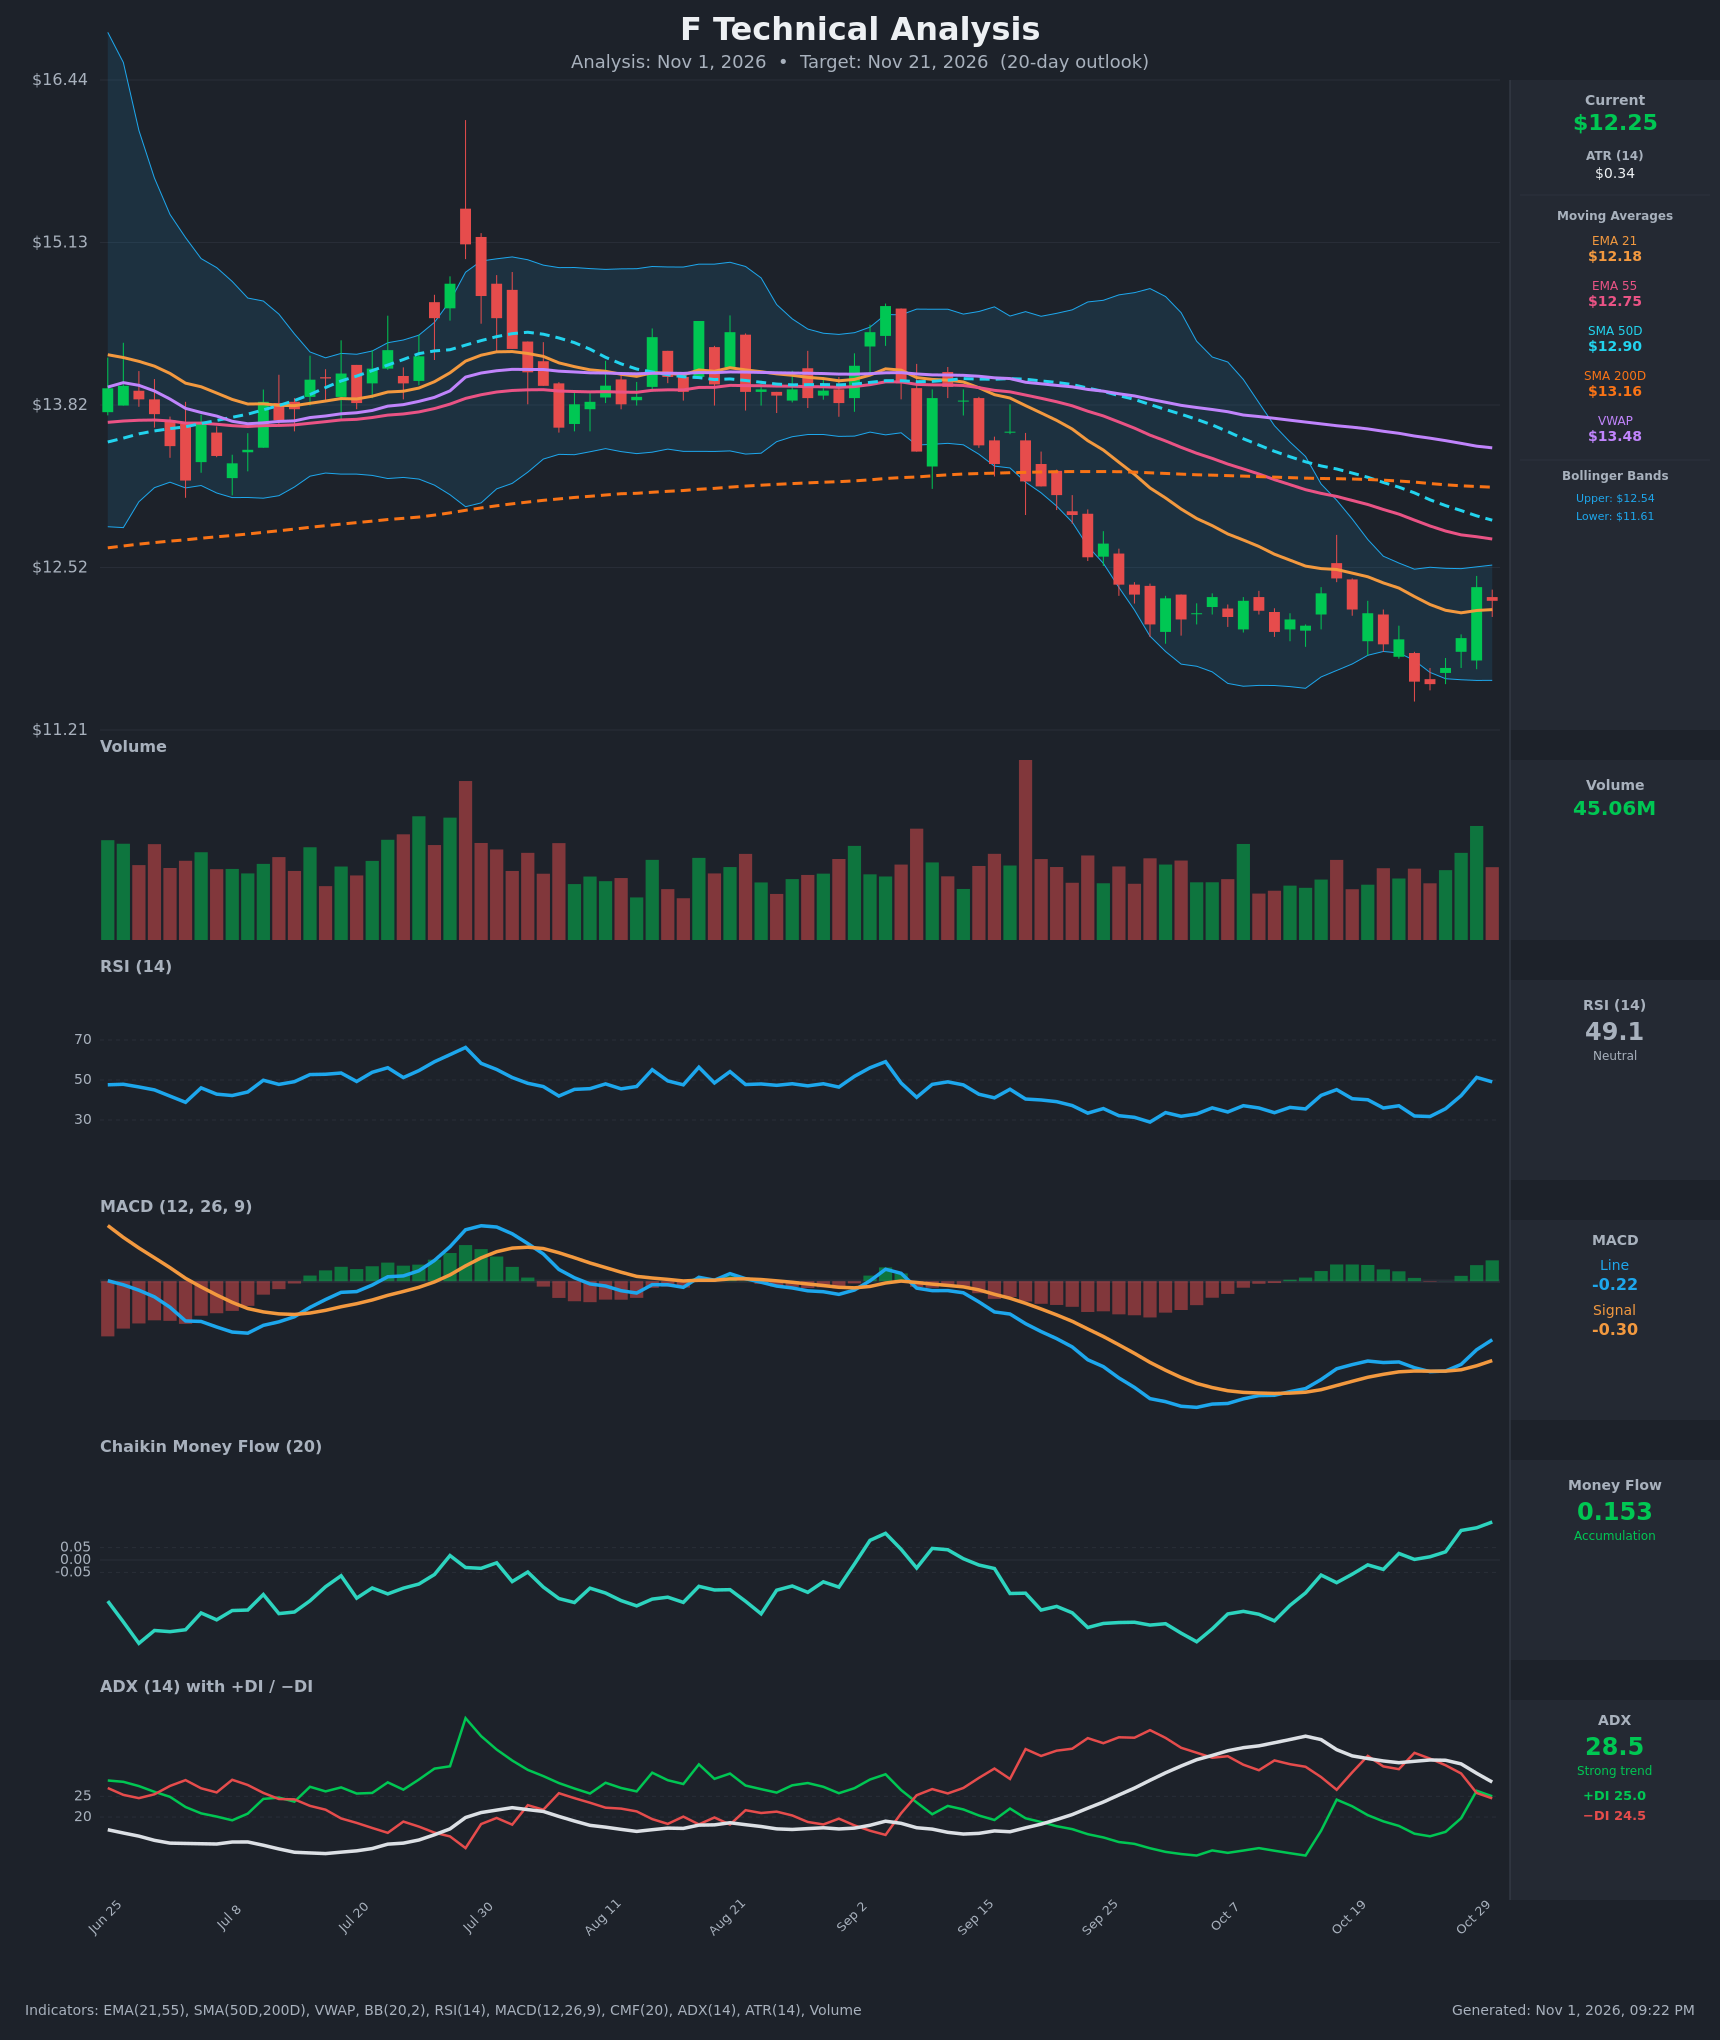
- RSI (14): 49.07, up sharply from the 31.7 oversold low on Oct 26 and back at the 50 midline. Momentum has recovered, but the last reading ticked down from 51.3. [Neutral]
- 20 EMA: The 21 EMA is $12.18 and price at $12.25 sits just above it, so it acts as first support. Price reclaimed it on Oct 29 after trading below it for two weeks. The 21 EMA is still sloping down, and it is well below the 55 EMA ($12.75), which keeps the medium-term trend bearish. [Neutral]
- MACD: The line (-0.223) is above the signal (-0.302), a bullish crossover that occurred around Oct 26-27. The histogram is positive and expanding, but all values are still below zero, so this is a recovery inside a larger downtrend. [Bullish]
- Bollinger Bands (20): The bands run $11.61 to $12.54 with a midline near $12.07. Price is in the upper half after bouncing off the lower band, and the bands are starting to narrow after the selloff. The upper band at $12.54 is the first hurdle. [Neutral]
- CMF (20): 0.153, well above +0.05 and rising from negative readings in mid-October. Buying pressure and accumulation are building even as price made its lows. [Accumulation]
- ADX (14): 28.5 and falling from 39.5, so the downtrend is losing strength. +DI (25.0) has crossed just above −DI (24.5), a marginal bullish DI crossover that signals no clear trend control yet. [Strong but weakening trend, direction transitioning from bearish to neutral]
- Volume: 45.06M, with the largest recent bar a big green candle near the lows and heavier volume on up days. Volume on the latest red candle was lighter. [Mildly bullish, supports a bottoming attempt]
DIVERGENCES & TRENDS
- Bullish divergence: Price made a marginal new low around $11.58 on Oct 26, but RSI (31.7 vs 32.0 on Oct 23) and MACD were flat to higher, and CMF has risen from negative to +0.153. Money flow is leading price higher.
- Moving averages: Price is below the 55 EMA ($12.75), SMA50 ($12.90), SMA200 ($13.16) and VWAP ($13.48). SMA50 is below SMA200, a death cross already in place, and the 21 EMA is below the 55 EMA. The long-term trend is still down.
- Crossovers: The MACD bullish crossover and the +DI/−DI crossover are both fresh. The 21 EMA is flattening and starting to curl up, and the gap to the 55 EMA is narrowing.
- Declining ADX: A falling ADX from a high level suggests the selling trend is exhausting, which favors a base or relief rally. The first real test is the $12.54 to $12.75 zone.
CHART PATTERNS
- Bullish Double Bottom: The lows at about $11.60 (Oct 23) and $11.58 (Oct 26) form a double bottom, and the neckline sits near $12.40-$12.45 (the Oct 16 high of $12.43). The ideal measured move is about $0.87 above the neckline, near $13.30. SMA50, SMA200 and VWAP overhead make that unlikely within 20 days, so the realistic target is the $12.75-$12.90 zone.
- Bullish Falling Wedge: The downtrend from September has narrowed into a wedge-like decline with lower volatility, which fits the bottoming read. A break above the $12.40-$12.54 area would confirm both patterns.
- Not confirmed: The double bottom is only confirmed on a close above the neckline.
POTENTIAL SCENARIOS
- Scenario 1: Bullish Double Bottom Breakout and Relief Rally — Price breaks the $12.45 neckline and BB upper band, helped by accumulation and the MACD crossover, then rallies into the declining 55 EMA and SMA50. Trigger: daily close above $12.55 on above-average volume. Target: $12.75-$12.90, with an extension to $13.05 possible. Invalidation: daily close below $11.95. (50% probability)
- Scenario 2: Bearish Trend Resumption — The rally fails at the $12.54-$12.75 resistance cluster, and the sellers who drove price from $13.80 return and push it back to the lows. Trigger: rejection at $12.55-$12.75 and a close below the 21 EMA ($12.18), then below $11.95. Target: $11.60, then $11.30. Invalidation: close above $12.80. (32% probability)
- Scenario 3: Neutral Range-Bound Chop — Price oscillates between $11.95 and $12.55 as ADX declines and the DIs stay entangled. Trigger: failure to break either $12.55 or $11.95. Target: $12.10-$12.40. Invalidation: close outside $11.90-$12.60. (18% probability)
PRICE TARGETS
- Target Price: $12.65 (20-day, moving toward the 55 EMA at $12.75 but capped by it and SMA50)
- Expected Range: $11.70 to $13.05. The width is $1.35, about 11% of the $12.25 current price, which fits the 14-21 day guidance of 8-12%.
- Key Levels: Support at $12.18 (21 EMA; below that $11.58-$11.60 double-bottom lows), Resistance at $12.75 (55 EMA; above that $12.90 SMA50)
OVERALL BIAS
OVERALL BIAS: BULLISH - A double bottom near $11.58, a positive MACD crossover, CMF at 0.153 and a falling ADX favor a relief rally toward $12.65-$12.75. The long-term trend is still bearish with price below SMA50, SMA200 and VWAP, so conviction is modest and gains should be capped near the 55 EMA and SMA50.
This is educational analysis and not financial advice.