MSFT 20-day bearish forecast — Nov 1, 2026
- Bias: Bearish
- Timeframe: 20 days (made Nov 1, 2026, target date Nov 20, 2026)
- Price at analysis: $521.91
- Price target: $512.00
- Expected range: $488.00 – $540.00
- Result: Pending — graded after the close on Nov 20, 2026
Get a free AI analysis of MSFT today
Analysis
TECHNICAL INDICATORS
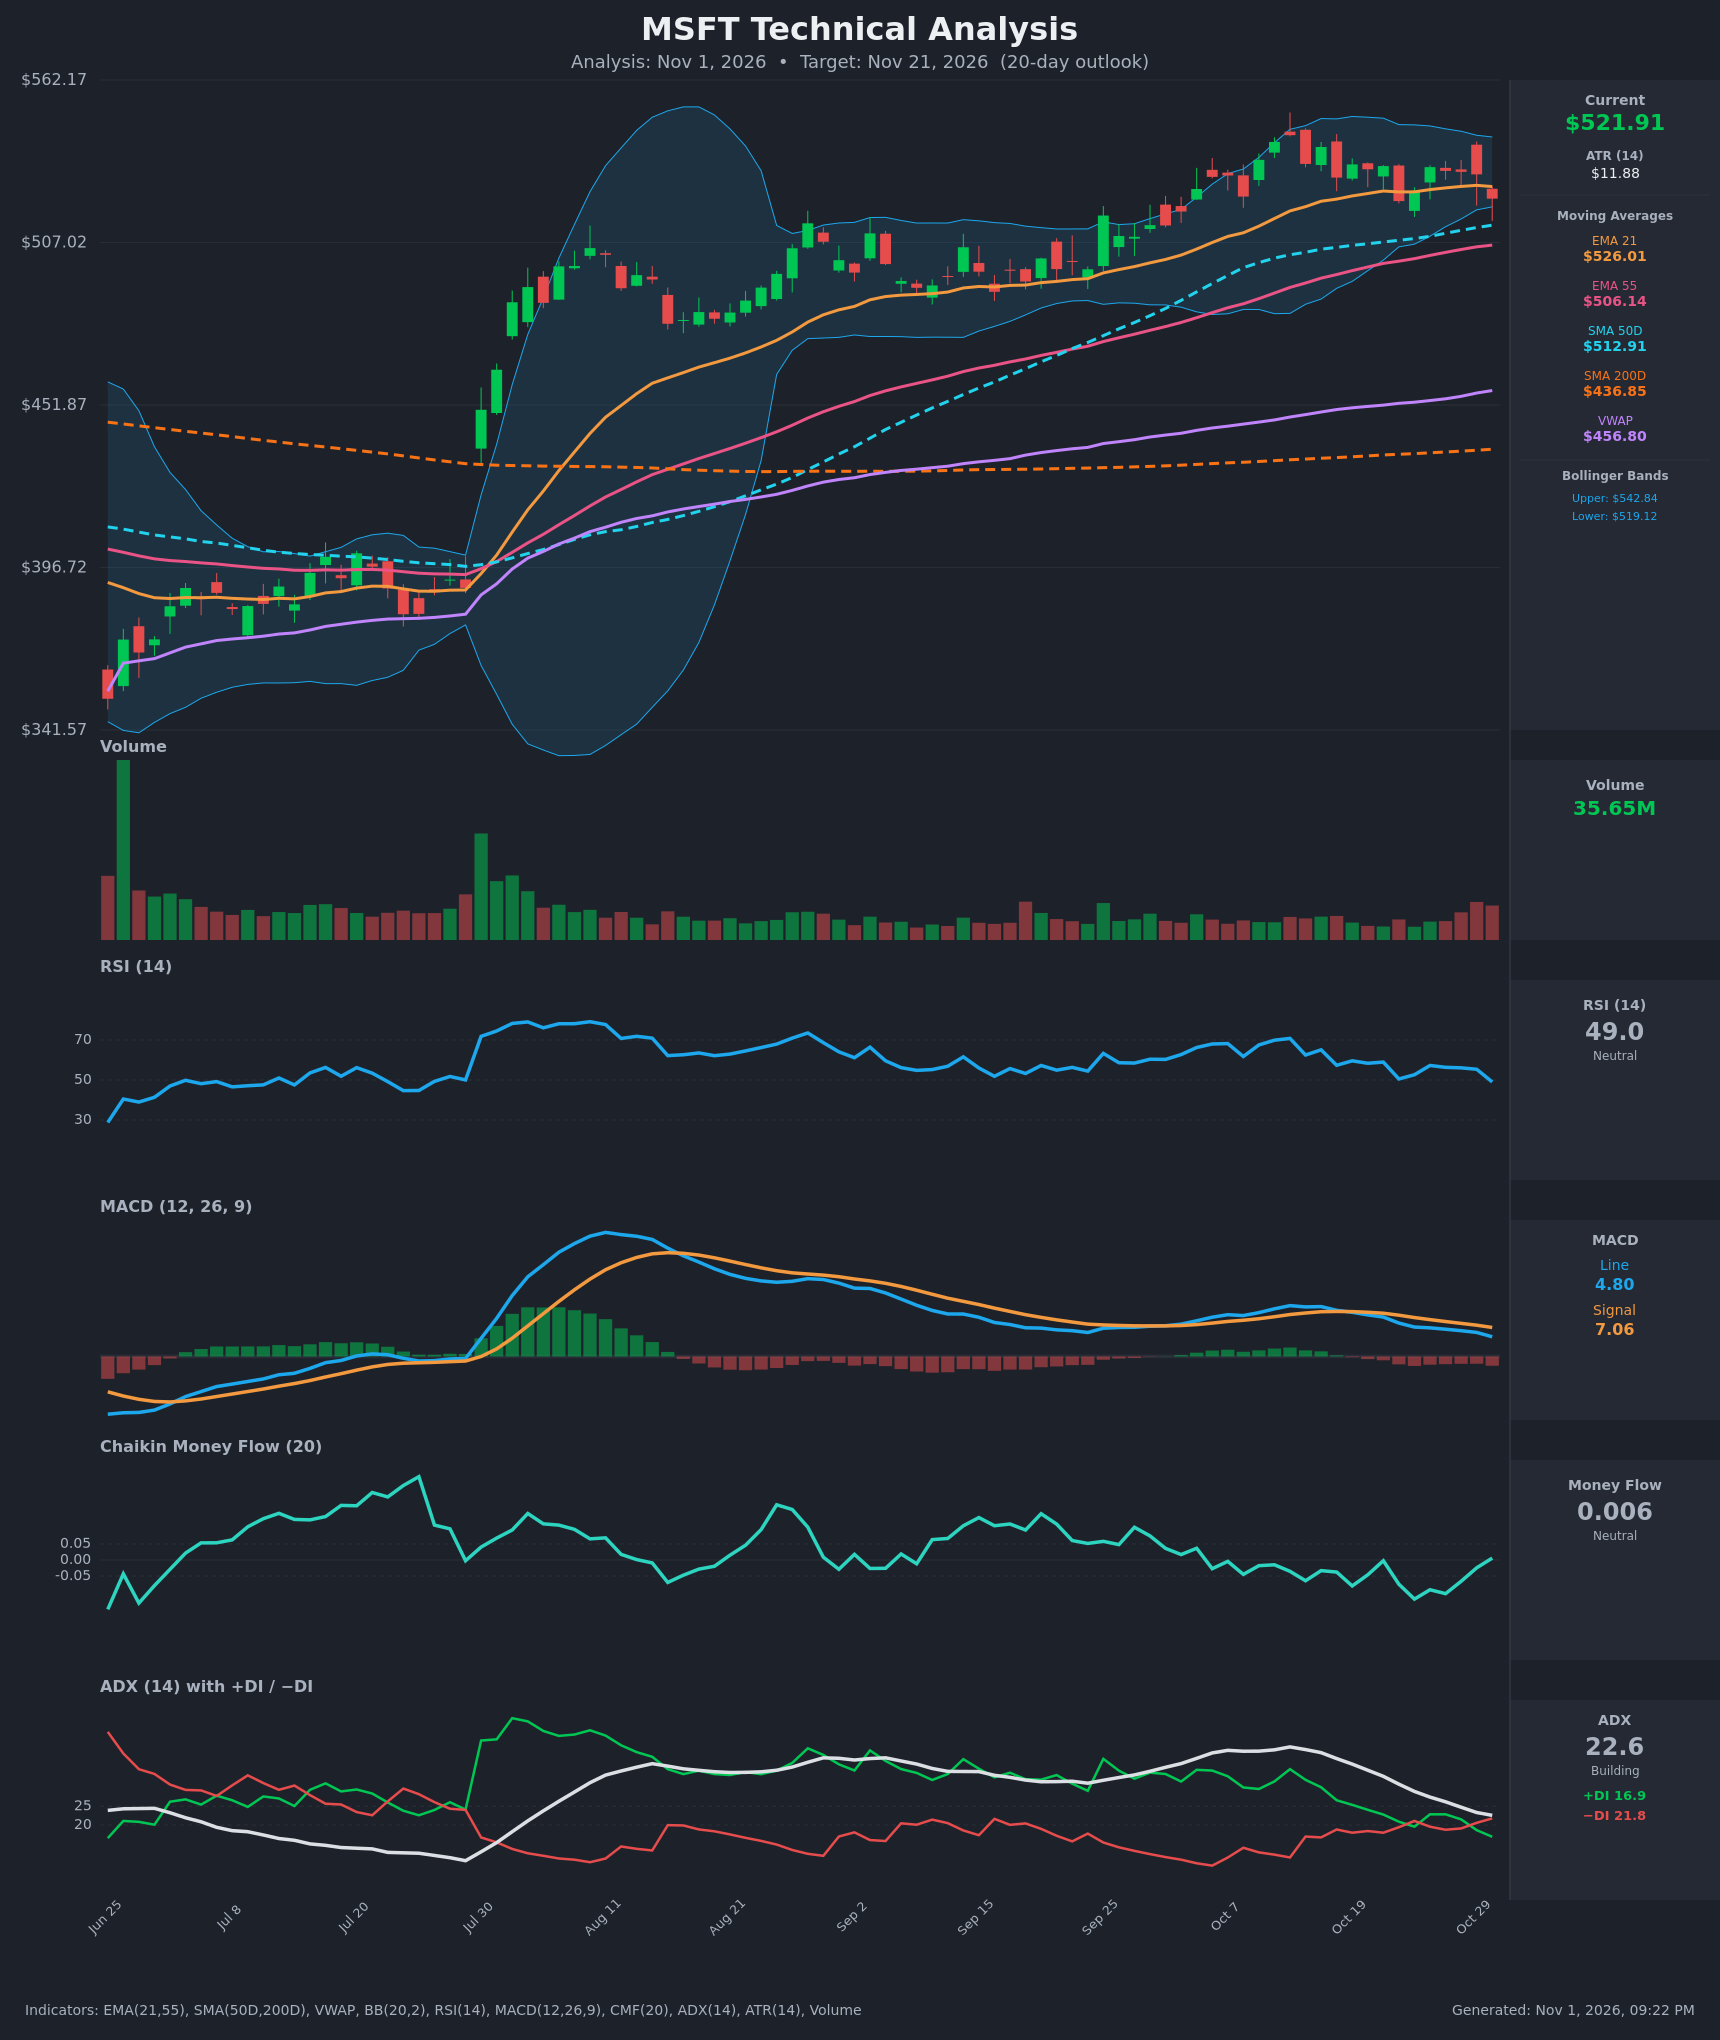
- RSI (14): 49.03, down from ~70 on Oct 12-13 and sitting right at the 50 midline. Momentum has faded steadily and the latest bar dropped about 6 points. [Neutral]
- 20 EMA: The 21 EMA is at $526.01 and price ($521.91) closed below it for the first time in several sessions, so it now acts as near-term resistance. The EMA is still rising slowly, and the longer EMA 55 ($506.14) sits well below as support. [Bearish]
- MACD: The line (4.80) is below the signal (7.06), with a negative histogram of about -2.26. The bearish crossover occurred around Oct 19 and the gap has widened since. The line is still positive, but momentum is clearly decaying. [Bearish]
- Bollinger Bands (20): The bands are $519.12 to $542.84. Price at $521.91 is hugging the lower band after a failed push toward the upper band. The bands are narrowing slightly (a squeeze is developing), and a break below the lower band would add to the downside pressure. [Bearish]
- CMF (20): 0.006, inside the ±0.05 neutral zone. It has been mostly negative through October and only just ticked back to zero, so there is no clear accumulation. [Neutral]
- ADX (14): 22.6, falling from 40+ in mid-October. The previous uptrend has lost strength and the market is drifting toward range conditions. −DI (21.8) has crossed above +DI (16.9), a bearish tilt. [Weak Trend, bearish lean]
- Volume: 35.65M on the latest red candle, which is above the recent quiet-day average. The last few down days show slightly elevated volume, which suggests mild distribution. [Mild bearish interpretation]
DIVERGENCES & TRENDS
- Price made a high near $543 on Oct 13, while RSI and MACD have since rolled over. Price stayed fairly elevated ($530s) while MACD fell from 12.4 to 4.8. This is a mild bearish momentum divergence, a fading of the rally rather than a sharp reversal.
- A bearish MACD signal-line crossover occurred around Oct 19 and has been confirmed by a widening histogram.
- DI crossover: −DI moved above +DI on Oct 23 and again on Oct 30, while ADX falls from 40 to 22.6. The trend is weakening, not reversing with force.
- Price is above SMA50D ($512.91), EMA55 ($506.14) and SMA200D ($436.85), so the larger structure is still bullish. The golden cross happened long ago, and the 50D is rising toward price.
- Price is far above VWAP ($456.80), which means the stock is extended relative to the anchored average.
- Price just lost the EMA21 and is pressing on the lower Bollinger band, which suggests a pullback toward the SMA50D/EMA55 area.
CHART PATTERNS
- Since mid-October, price has made lower highs ($543 → $539 → $533 → $532) with a base near $521-$524. This resembles a Bearish Double Top / Head-and-Shoulders-like distribution, or a Descending Triangle on a small scale, with support near $521. A break below $520 would project toward roughly $500-$505.
- The larger structure is a strong uptrend since July with a high-level consolidation. A bull flag/continuation is possible if the SMA50D (~$513-$515) holds, targeting a retest of $540+.
- The reversal patterns are not confirmed and the pullback sits above major supports, so this is a moderate correction, not a trend change.
POTENTIAL SCENARIOS
- Scenario 1: Bearish Pullback to the SMA50D/EMA55 zone — MACD is below signal, −DI is above +DI, price has lost the EMA21 and sits on the lower band. A break of the $519-$521 support would target the rising SMA50D and EMA55. Trigger: daily close below $519. Target: $505-$510. Invalidation: a daily close back above $531. (50% probability)
- Scenario 2: Neutral Range-Bound Consolidation — ADX below 25 and falling, and CMF at zero, suggest a sideways drift between $510 and $535. Trigger: price holds the $512-$520 area and stalls under the EMA21. Target: $515-$530. Invalidation: a close outside $508-$537. (20% probability)
- Scenario 3: Bullish Rebound/Continuation — The long-term uptrend is intact, and a bounce off the lower band and SMA50D support could reclaim the EMA21 and retest the highs. Trigger: close above $527 with MACD histogram turning up. Target: $540-$545. Invalidation: a close below $512. (30% probability)
PRICE TARGETS
For a 20-day horizon (Nov 21, 2026), the range width should be about 8-12% of the current price (roughly $42-$63). The ATR is $11.88, so a 20-day move is reasonably ±$25-30.
- Target Price: $512.00 (a pullback toward the SMA50D/EMA55 zone)
- Expected Range: $488.00 to $540.00 (width $52, about 10% of current price)
- Key Levels: Support at $512.91 (SMA50D), Resistance at $526.01 (EMA21)
OVERALL BIAS
OVERALL BIAS: BEARISH - MACD is below its signal line and falling, −DI is above +DI, price lost the EMA21 and sits on the lower Bollinger Band with fading RSI. The most likely path is a pullback toward the rising SMA50D/EMA55 support near $505-$513, although the long-term uptrend remains intact.
This is educational analysis and not financial advice.