IBM 20-day bullish forecast — Nov 1, 2026
- Bias: Bullish
- Timeframe: 20 days (made Nov 1, 2026, target date Nov 20, 2026)
- Price at analysis: $257.81
- Price target: $263.50
- Expected range: $246.00 – $272.00
- Result: Pending — graded after the close on Nov 20, 2026
Get a free AI analysis of IBM today
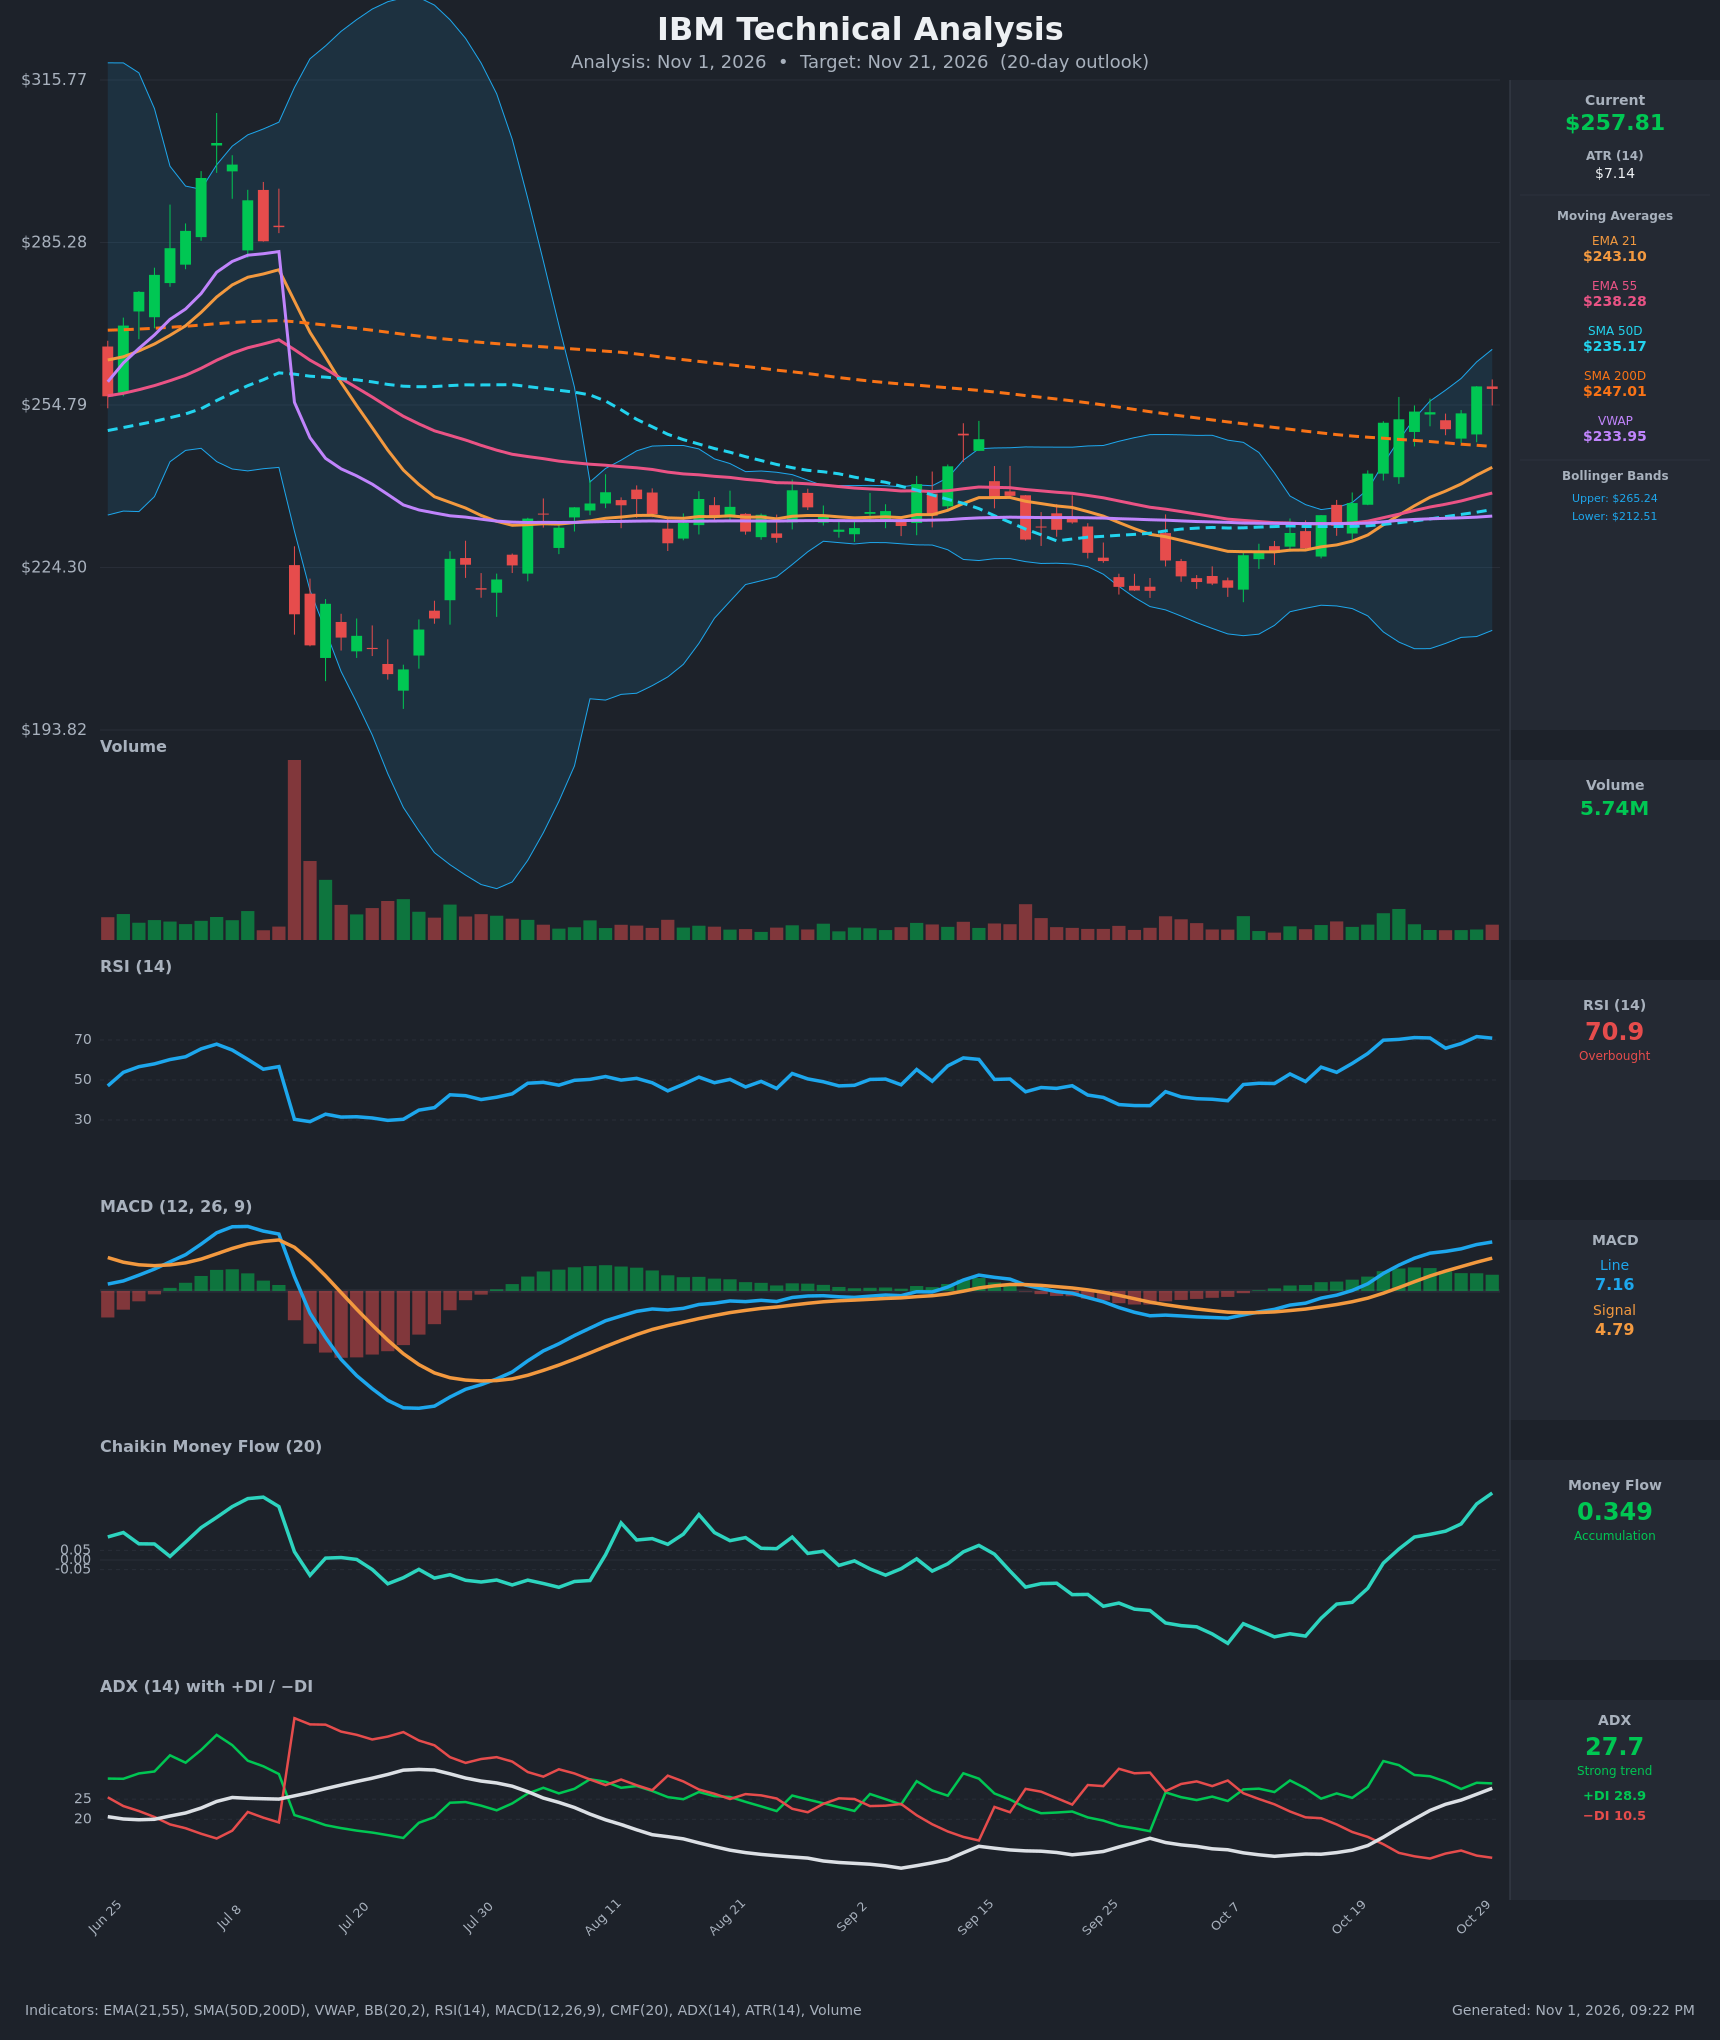
Analysis
TECHNICAL INDICATORS
- RSI (14): 70.92, just inside overbought and flat for about a week (70-72). It rose from 48 on Oct 12, so momentum is strong, but the reading leaves little room before a pullback or digestion phase. [Bullish] (stretched, with a near-term cooling risk)
- 20 EMA (EMA 21): $243.10 and rising steeply. Price is about 6% above it, so it is dynamic support. EMA21 crossed above EMA55 ($238.28) around Oct 23, a bullish crossover. Price is also above SMA50D ($235.17) and SMA200D ($247.01). [Bullish]
- MACD: Line 7.16 is above signal 4.79 and both are above zero. The histogram is positive and has widened for 10+ sessions (the line-signal gap grew from about 0.5 to 2.4). There is no sign of rollover. [Bullish]
- Bollinger Bands (20): Upper $265.24, lower $212.51, so the bands are wide from the July volatility. Price at $257.81 is in the upper quarter of the bands, about $7.4 (roughly 1 ATR) below the upper band. The bands are starting to widen upward, which is consistent with a trend leg. A walk along the upper band is possible. [Bullish]
- CMF (20): +0.349, well above +0.05. It has risen from -0.40 on Oct 12 and is at its highest in the visible window. This indicates strong accumulation. [Accumulation]
- ADX (14): 27.7 and rising (from about 11 on Oct 12). +DI at 28.9 is far above −DI at 10.5. The trend has become established and strong, with bulls clearly in control. [Strong Trend – Bullish]
- Volume: 5.74M today, below the breakout-day volume of the Oct 21-22 surge. Recent up-days had decent volume, but the last few bars are lighter, so confirmation is only moderate. [Neutral to mildly Bullish]
DIVERGENCES & TRENDS
- Divergences: There is no bearish RSI or MACD divergence yet. Price made a marginal new high at $258.28 on Oct 29, RSI was 71.7, and MACD and CMF made new highs. RSI has plateaued at 70-72 while price moved higher, so watch for a divergence if price pushes above $260 with RSI below 70.
- Trends: Everything has turned up sharply from the Oct 7-12 base. CMF flipped from deeply negative (distribution) to strongly positive, and ADX is rising with +DI dominant.
- Crossovers and breaks:
- Price reclaimed SMA200D ($247.01) on Oct 21 and has held above it for 8 sessions.
- EMA21 crossed above EMA55 on about Oct 23. SMA50D ($235.17) is still below SMA200D ($247.01), so a golden cross has not occurred, but the gap is narrowing and could close within weeks.
- Price is well above VWAP ($233.95), which is a buyer-dominated reading.
- The MACD line crossed above the signal and above zero.
- Risk note: Price is 10% above EMA55 and 6% above EMA21, so it is stretched. Consolidation or a shallow pullback toward the SMA200 would be normal within the trend.
CHART PATTERNS
- Base-and-breakout from the Aug-Oct range: After the July collapse, IBM spent about 3 months in a $217-$254 range with rising lows. It broke out on Oct 21 on a large candle through the 200-day SMA and the Sep highs near $252. This resembles a Bullish Ascending Triangle / Triple-Bottom-type breakout, with a measured move of roughly range height ($254 - $217 ≈ $37) projected from the breakout near $252, which implies about $285-$289 as a longer-term target.
- Short-term Bullish Flag/Pennant: The last 7 sessions (Oct 22-30) form a tight $250-$258 consolidation after the $227-$251 impulse. This fits a Bullish Flag/Pennant continuation, with a breakout above $258.30 targeting $265-$270 (the upper Bollinger Band and prior gap-fill area).
- Overhead supply: The July gap-down zone around $270-$285 is likely resistance. For this 20-day window, I expect only partial progress toward it.
POTENTIAL SCENARIOS
- Scenario 1: Bullish Flag Breakout Continuation — Strong trend (ADX 27.7, CMF 0.35, MACD widening) resolves the tight consolidation upward and price pushes into the upper Bollinger Band region. Trigger: daily close above $258.30 with volume above about 6-7M. Target: $265-$270, with an extension toward $272 if the band expands. Invalidation: daily close below $250, then $247 (SMA200). (50% probability)
- Scenario 2: Bearish Overbought Pullback — RSI above 70 and price about 6% over EMA21 triggers profit-taking. Price retests the SMA200 and EMA21 zone, and MACD histogram shrinks. Trigger: close below $250 and failure to hold $247. Target: $243-$247, and $235-$238 (SMA50D/EMA55) if selling extends. Invalidation: a reclaim of $258+ on volume. (30% probability)
- Scenario 3: Neutral Sideways Digestion — Price consolidates between SMA200 support and the upper band while the moving averages catch up. Trigger: repeated failures at $262-$265 with holds at $248-$250. Target: $252-$262. Invalidation: a decisive close outside the $247-$266 band. (20% probability)
PRICE TARGETS
- Target Price: $263.50 (20-day, Nov 21, 2026)
- Expected Range: $246.00 to $272.00 (width $26 = ~10.1% of current price, in line with the 14-21 day guideline of 8-12%)
- Key Levels: Support at $247.01 (SMA200D; EMA21 at $243.10 below it), Resistance at $265.24 (upper Bollinger Band; $270+ is the next supply area)
OVERALL BIAS
OVERALL BIAS: BULLISH - A strong, accelerating trend (ADX 27.7 with +DI far above −DI, CMF +0.35, widening MACD histogram) and a breakout above the 200-day SMA and the 3-month range favor continuation. RSI at 71 and the proximity to the upper Bollinger Band mean conviction is moderate, and a pullback toward $247 is a real risk.
This is educational analysis and not financial advice.