HOOD 20-day bearish forecast — Nov 1, 2026
- Bias: Bearish
- Timeframe: 20 days (made Nov 1, 2026, target date Nov 20, 2026)
- Price at analysis: $84.99
- Price target: $82.00
- Expected range: $77.00 – $87.00
- Result: Pending — graded after the close on Nov 20, 2026
Get a free AI analysis of HOOD today
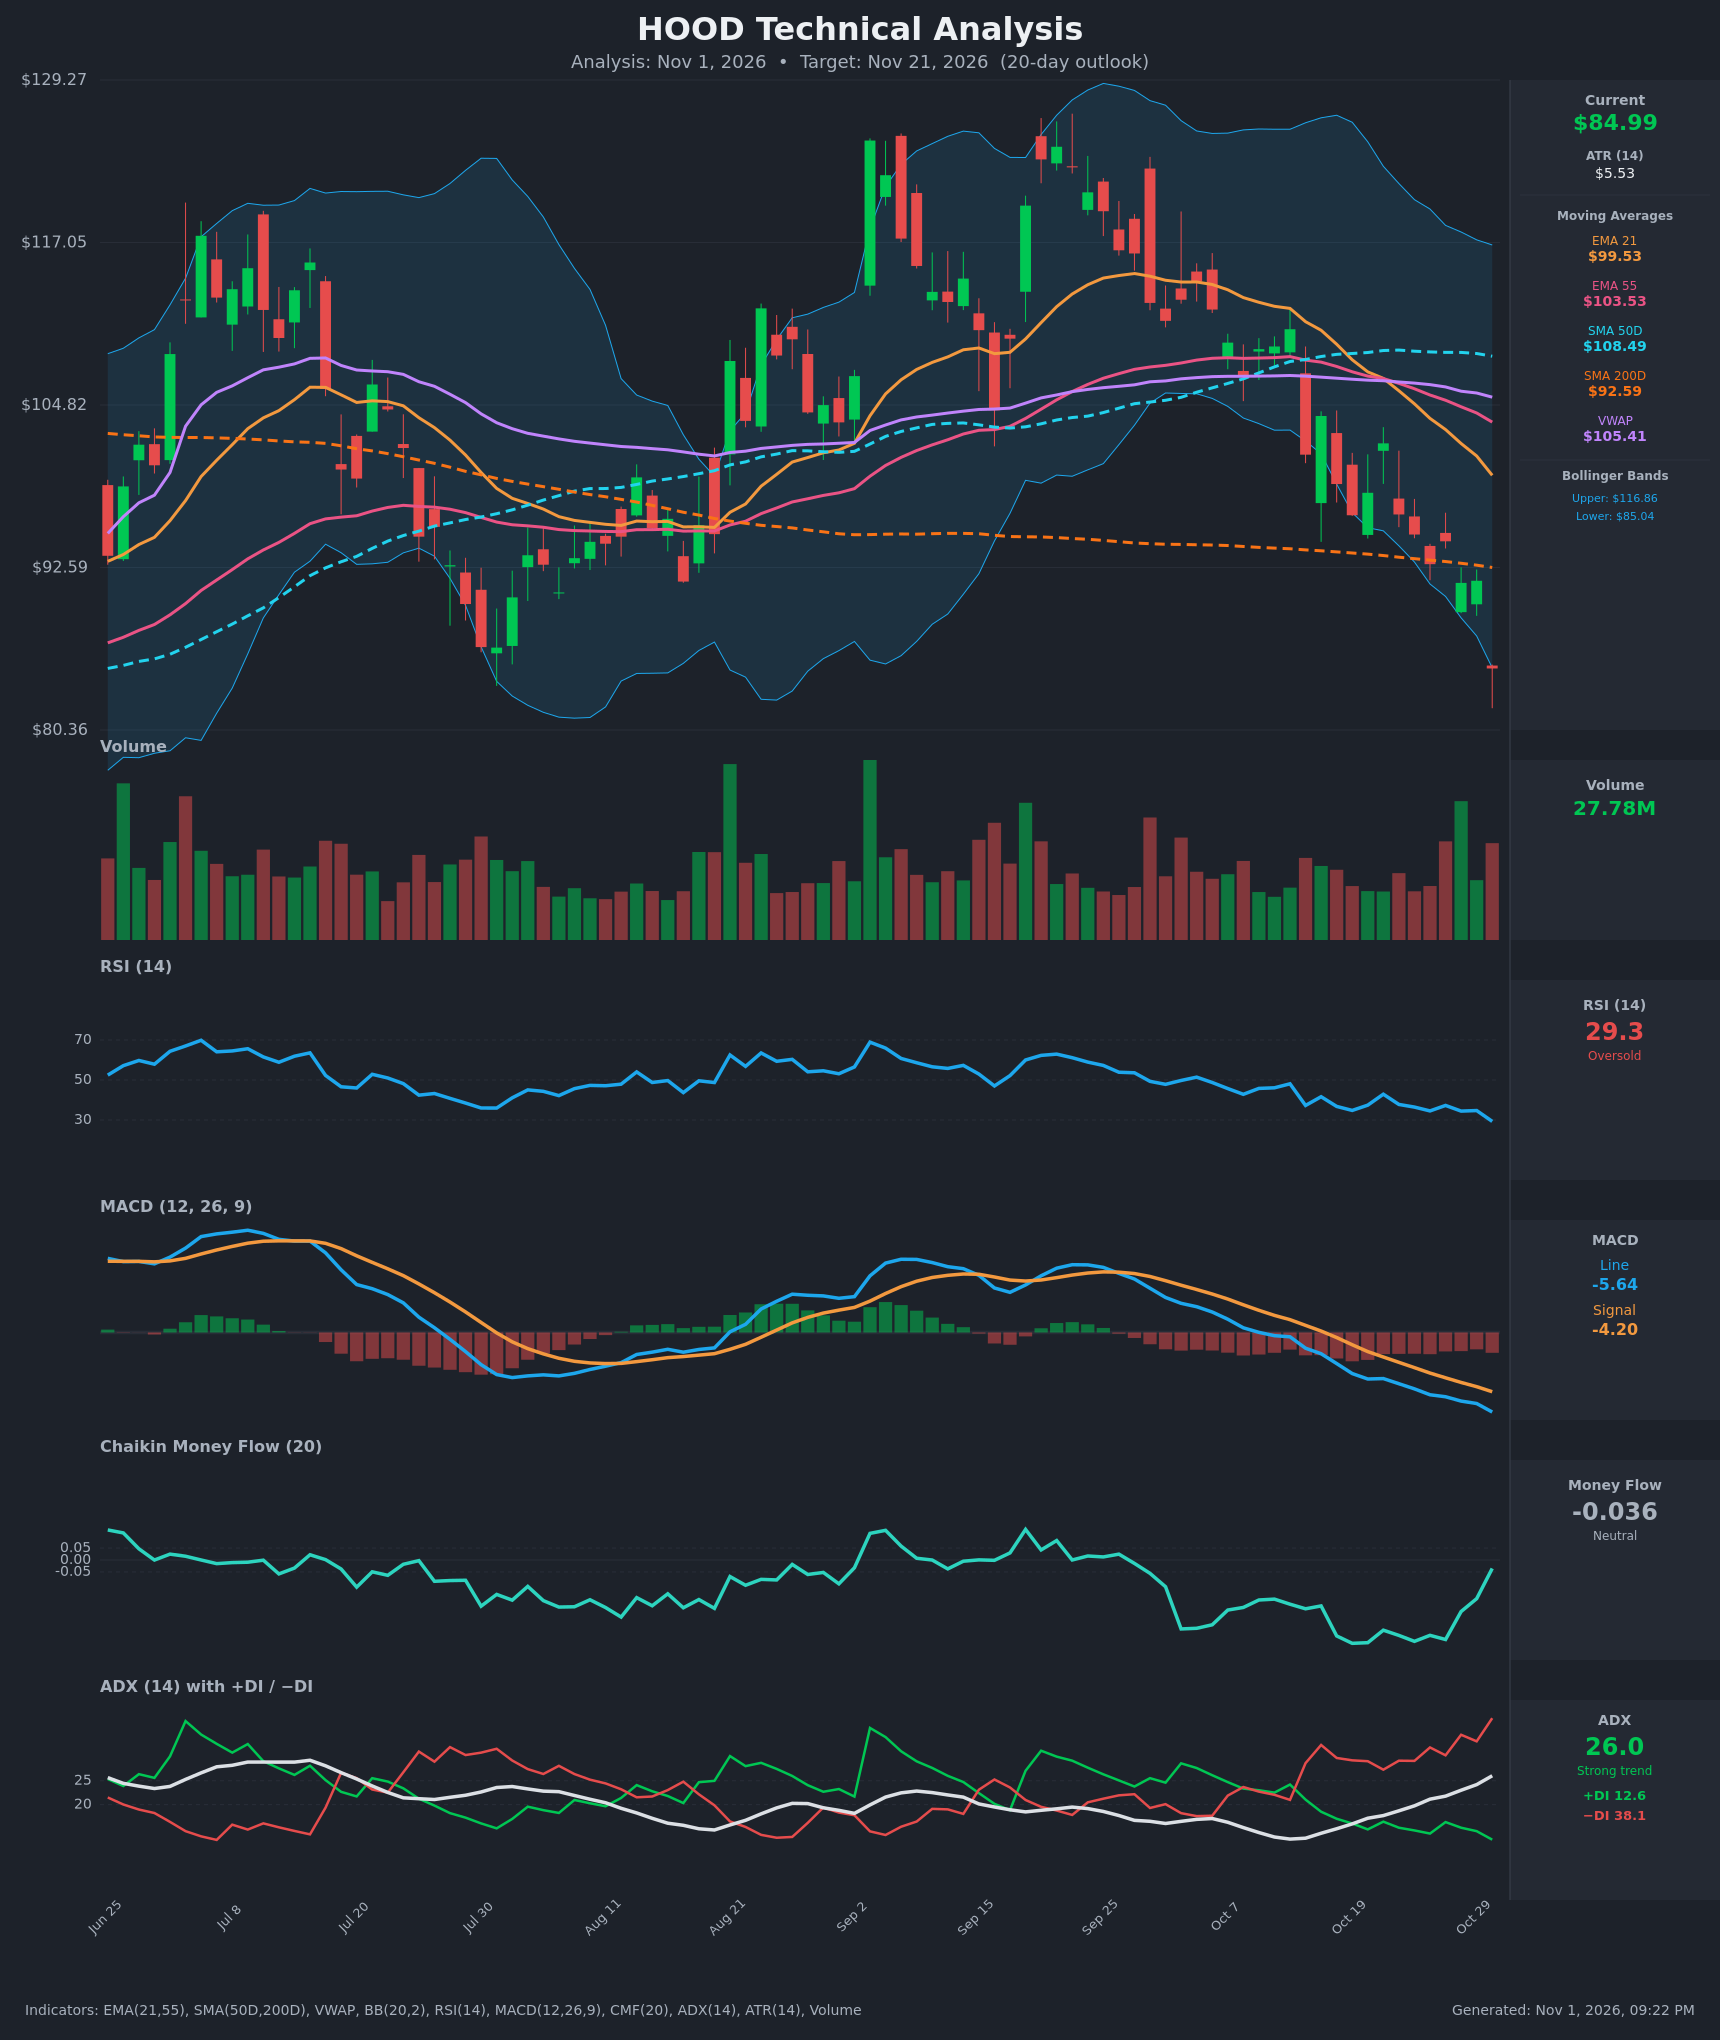
Analysis
TECHNICAL INDICATORS
- RSI (14): 29.3, in oversold territory and at its lowest in the visible window (it was 46 on Oct 12, and every bounce has failed below 43). Momentum is falling, though oversold readings raise the odds of a relief bounce. [Bearish]
- 20 EMA: The 21 EMA is $99.53, with the 55 EMA at $103.53. Price is about 15% below the 21 EMA, which now acts as resistance. The 21 EMA crossed below the 55 EMA around Oct 21 and the gap is widening. [Bearish]
- MACD: The line is -5.64, below the signal at -4.20, and the histogram is increasingly negative. The bearish crossover happened around Oct 16 and the spread is still expanding, so downside momentum has not yet rolled over. [Bearish]
- Bollinger Bands (20): Price is $84.99 against a lower band of $85.05, so it is pinned at or just below the lower band. Bandwidth is wide ($85 to $117) and the bands are now turning down. This is a band walk, but it is also stretched enough for a snap-back toward the $100 midline. [Bearish]
- CMF (20): -0.036, in the neutral zone. It has recovered sharply from about -0.35 even as price made lower lows, a modest bullish divergence in money flow. [Neutral]
- ADX (14): 26.0 and rising, with -DI at 38.1 far above +DI at 12.6, which is near its lows. The bears have clear control and the trend is strong, with ADX crossing above 25. [Strong Trend – Bearish]
- Volume: 27.78M on the latest bar, elevated, with heavy red bars on the breakdown legs. The last candle shows a long lower wick down to roughly $80, which suggests some dip-buying, but the close stayed weak. [Bearish with early capitulation hints]
Other trend references:
- The SMA200D is $92.59 and price has now closed below it, which turns long-term structure bearish.
- The SMA50D is $108.49, well above price.
- VWAP is $105.41, about 19% above price, so sellers dominate.
DIVERGENCES & TRENDS
- Price vs RSI: There is no bullish RSI divergence. RSI made a new low (29.3) in line with price, so momentum confirms the decline.
- Price vs CMF: CMF has risen from about -0.35 to -0.04 while price fell to new lows, a mild bullish divergence. It signals selling pressure fading, but it needs price confirmation.
- MACD: The line is below the signal and below zero with an expanding negative histogram, so momentum is still bearish.
- ADX/DI: The bearish DI crossover occurred on Oct 14. ADX has climbed from 13 to 26, which confirms a developing strong downtrend rather than noise.
- Moving averages: The 21 EMA crossed below the 55 EMA, and price has lost the SMA200D. The SMA50D is still above the SMA200D, so there is no death cross yet, but the gap ($108.49 vs $92.59) will narrow if price stays weak.
- Price action: Price fell from about $110 to $85 (about -23%) in 13 sessions, with lower highs on every bounce ($110 → $104 → $102 → $94.6).
CHART PATTERNS
- Bearish Double Top (reversal): The September highs near $124-125 formed two peaks. The neckline was around $100-104, the Aug/Sep consolidation floor, and it broke around Oct 14. The measured move is roughly $22 of pattern height below the neckline, which points to about $80-82. That is where price is now trading and where the long wick reached.
- Descending channel / bearish flag character: The sequence of lower highs and lower lows after the neckline break resembles a bearish continuation channel. The Oct 21 bounce to $101.93 failed at the falling 21 EMA.
- Implication: Most of the double-top measured move is already complete, so further downside is likely to be smaller and choppier. This argues for modest downside, with a relief bounce as a real alternative.
POTENTIAL SCENARIOS
- Scenario 1: Bearish Trend Continuation / Measured-Move Completion — The downtrend persists with -DI dominant and ADX rising. Any bounce stalls under the SMA200D and 21 EMA, and price grinds to the $80 area and slightly below. Trigger: a daily close below $80.36 (the wick low). Target: $80-$82, with an extension toward $77. Invalidation: a daily close above $92.59 (SMA200D). (50% probability)
- Scenario 2: Bullish Oversold Relief Bounce — RSI near 29, price at the lower Bollinger Band, a long lower wick and improving CMF set up a mean-reversion rally. Trigger: a close above $89-$90 on rising volume. Target: $92.59 (SMA200D), with a stretch to $96. Invalidation: a close back below $82. (35% probability)
- Scenario 3: Neutral Base Building — Price chops between roughly $80 and $90 as selling exhausts without a clear recovery. Trigger: ADX rolls over below 25 with price holding $80-$90. Target: $84-$87. Invalidation: a close outside $79-$91. (15% probability)
PRICE TARGETS
Timeframe: 20 days (target date Nov 21, 2026).
- Target Price: $82.00
- Expected Range: $77.00 to $87.00 (width $10.00, about 11.8% of the current price, in line with 8-12% for a 14-21 day horizon)
- Key Levels: Support at $80.36, Resistance at $92.59
OVERALL BIAS
OVERALL BIAS: BEARISH - Price is below every key moving average including the SMA200D, with a widening bearish MACD, ADX above 25 and -DI far above +DI, plus a double-top breakdown whose measured move points to about $80-82. The oversold RSI and recovering CMF argue for a bounce, so the expected downside is modest rather than a sharp collapse.
This is educational analysis and not financial advice.