GOOGL 20-day bearish forecast — Nov 1, 2026
- Bias: Bearish
- Timeframe: 20 days (made Nov 1, 2026, target date Nov 20, 2026)
- Price at analysis: $279.84
- Price target: $272.00
- Expected range: $256.00 – $288.00
- Result: Pending — graded after the close on Nov 20, 2026
Get a free AI analysis of GOOGL today
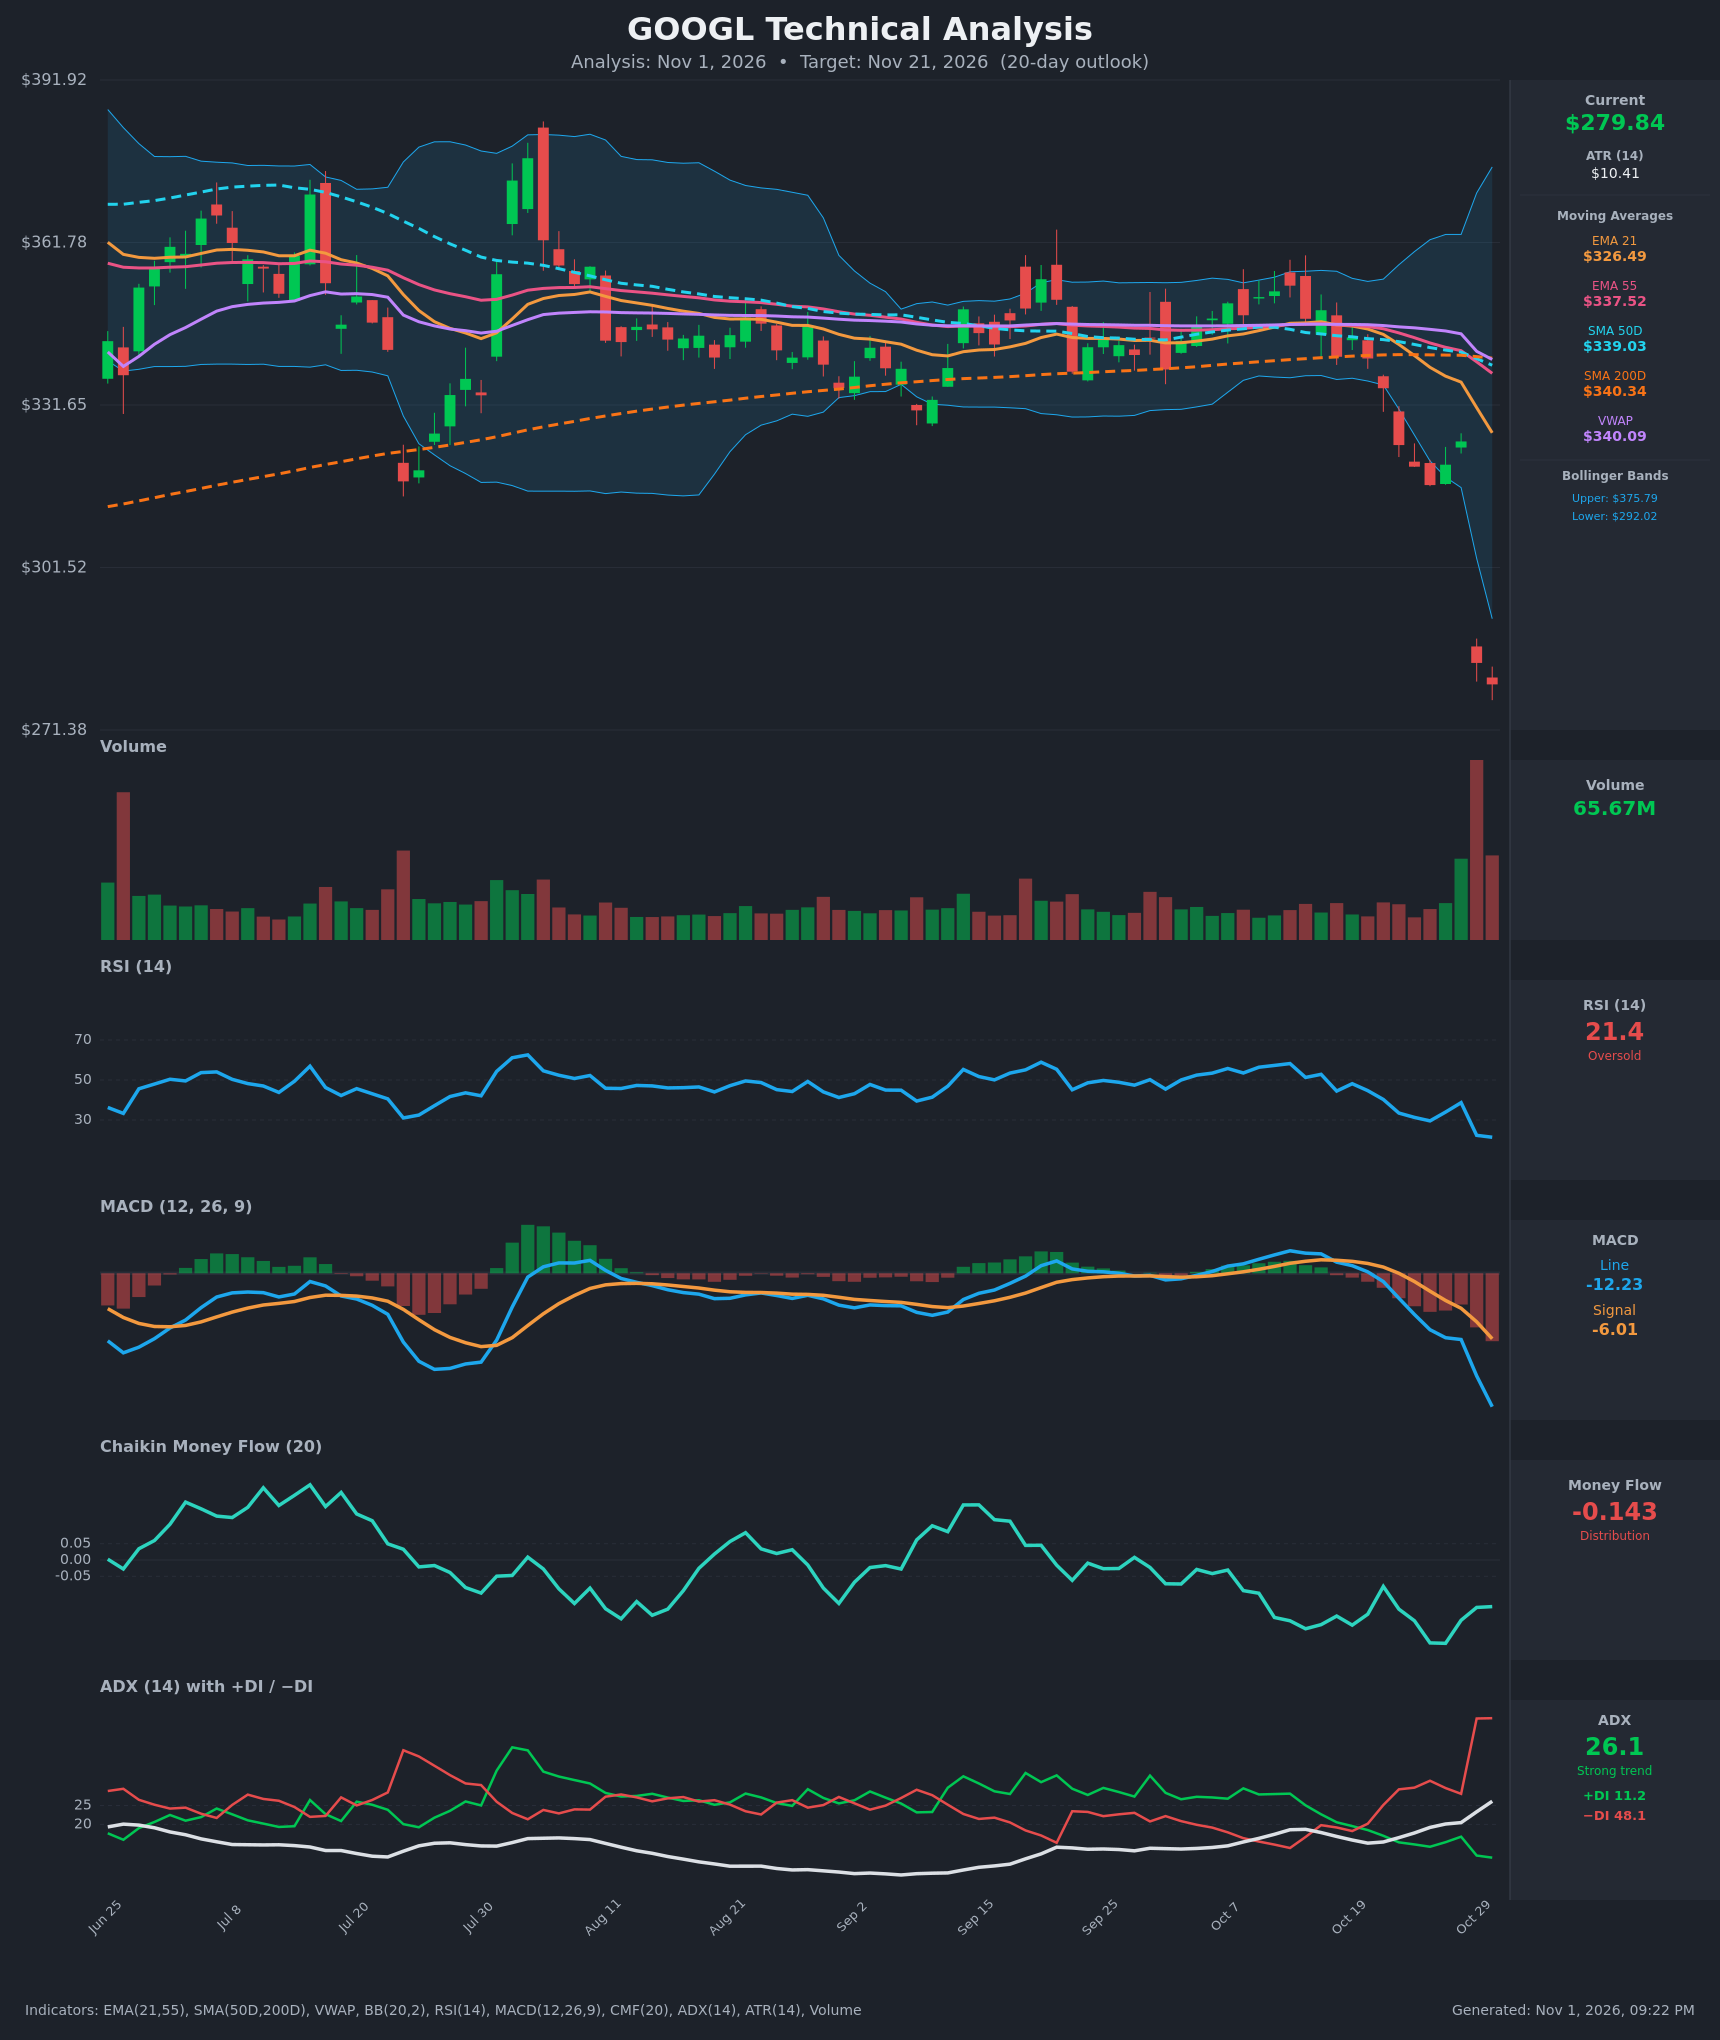
Analysis
TECHNICAL INDICATORS
- RSI (14): 21.38, deeply oversold and down from 38.7 two sessions ago and 57 in mid-October. Momentum is still falling and there is no bullish divergence yet. Oversold readings can persist in a fresh breakdown, but they raise the odds of a relief bounce. [Bearish]
- 20 EMA: The data gives EMA 21 at $326.49, and price at $279.84 is about 14% below it. The EMA is sloping down sharply, EMA21 has crossed below EMA55 ($337.52), and the EMA now acts as heavy overhead resistance. [Bearish]
- MACD: The line is -12.23 against a signal of -6.01. It crossed bearish around Oct 21-22 and the gap is widening, with a deeply negative, expanding histogram. There is no sign of momentum turning. [Bearish]
- Bollinger Bands (20): The bands span $292.02 to $375.79 and are widening sharply on the volatility spike. Price is about $12 (4%) below the lower band, a statistical extreme. In a strong trend this is "band-walking" and a sign of strength in the move, but it also sets up a snap-back toward the lower band or mid-band. [Bearish]
- CMF (20): -0.143, well below the -0.05 threshold. It has been negative for most of the last three months and is holding near its lows, so distribution is persistent. [Distribution]
- ADX (14): 26.1 and rising from about 15, so a strong trend is emerging. −DI at 48.1 is far above +DI at 11.2, a wide gap showing bears firmly in control. [Strong Trend – Bearish]
- Volume: The Oct 29 gap-down day printed by far the largest volume bar on the chart, and Oct 30 stayed elevated at 65.67M on a lower close. This is heavy institutional selling with follow-through. It is potentially climactic, but there is no reversal candle yet. [Bearish – heavy distribution]
DIVERGENCES & TRENDS
- There is no bullish divergence. RSI, MACD and CMF all made new lows alongside price, so the indicators confirm the move.
- Price is far below all key averages: EMA21 $326.49, EMA55 $337.52, SMA50D $339.03, SMA200D $340.34 and VWAP $340.09. These are stacked in a tight $326–$340 band and form a heavy resistance zone.
- SMA50D is now rolling over and about to cross below SMA200D (a death cross is nearing: $339.03 vs $340.34). That is a major long-term bearish signal.
- Price broke down out of a long, flat consolidation of roughly $335–$355 (Aug–Oct). It dropped from ~$325 to ~$284 in a single gap, an unusual 12–13% move that points to an event-driven repricing.
- The gap sits in empty air, so there is no nearby structural support. The −DI spike and ADX turning up show trend strength building.
- The main counter-signal is the extreme stretch: RSI at 21 and price 4% below the lower Bollinger Band. A dead-cat bounce is likely at some point, but it would probably be sold into near $292–$300 given overhead supply.
CHART PATTERNS
- Range breakdown (resembles the Bearish Triple Top / Descending breakdown in the diagram): The sideways range from Aug to Oct, with repeated failures near $350–$360 and lower highs, resolved downward through a gap. A measured move of the roughly $20–$25 range height from the $325 breakdown area projects to about $300 and has already been exceeded.
- Island/exhaustion-gap risk: The gap-down on climactic volume could mark capitulation. A bullish reversal pattern (Double Bottom or Falling Wedge) would need a retest of $280 with RSI divergence, and none exists yet.
- Significance: Until price reclaims the gap area ($292–$325), the pattern favors a bearish continuation or a weak bounce that fails. Gap fills are rare within 20 days after a high-volume event drop.
POTENTIAL SCENARIOS
- Scenario 1: Bearish Continuation / Post-Event Drift — Sellers keep control after the gap breakdown. Any bounce stalls under the lower Bollinger Band, and price grinds lower as −DI stays dominant and CMF stays negative. Trigger: close below the Oct 30 low (~$276) on above-average volume. Target: $265–$272 (an ATR-based extension of about 1 ATR per 3–4 days). Invalidation: daily close above $292 (lower Bollinger Band). (47% probability)
- Scenario 2: Bullish Oversold Relief Bounce — Capitulation volume exhausts sellers and RSI mean-reverts from 21, producing a rebound toward the lower band and partway to the gap. Trigger: a bullish reversal candle with a close above $290 and RSI rising above 30. Target: $295–$305, with the $326 EMA21 as a stretch. Invalidation: loss of $270 on a closing basis. (38% probability)
- Scenario 3: Neutral Base Building — Price stabilizes in a tight range as volatility compresses and the market digests the gap. Trigger: several sessions of narrow candles between $272 and $292. Target: $275–$290. Invalidation: close outside that range with volume. (15% probability)
PRICE TARGETS
- Target Price: $272.00 (20-day horizon, about 2.8% below current)
- Expected Range: $256.00 to $288.00 (width $32 = 11.4% of current price, consistent with the 14–21 day guidance)
- Key Levels: Support at $268.00, Resistance at $292.00
OVERALL BIAS
OVERALL BIAS: BEARISH - Every trend and momentum indicator is aligned down: price is far below all moving averages, MACD is accelerating lower, −DI of 48 dominates +DI, and CMF shows persistent distribution after a high-volume gap breakdown. Extreme oversold conditions (RSI 21, price below the lower Bollinger Band) make a relief bounce a real risk, but with no divergence or reversal candle, continuation or a failed bounce is the slightly higher-probability path.
This is educational analysis and not financial advice.