NBIS 20-day bearish forecast — Nov 1, 2026
- Bias: Bearish
- Timeframe: 20 days (made Nov 1, 2026, target date Nov 20, 2026)
- Price at analysis: $154.14
- Price target: $144.00
- Expected range: $124.00 – $170.00
- Result: Pending — graded after the close on Nov 20, 2026
Get a free AI analysis of NBIS today
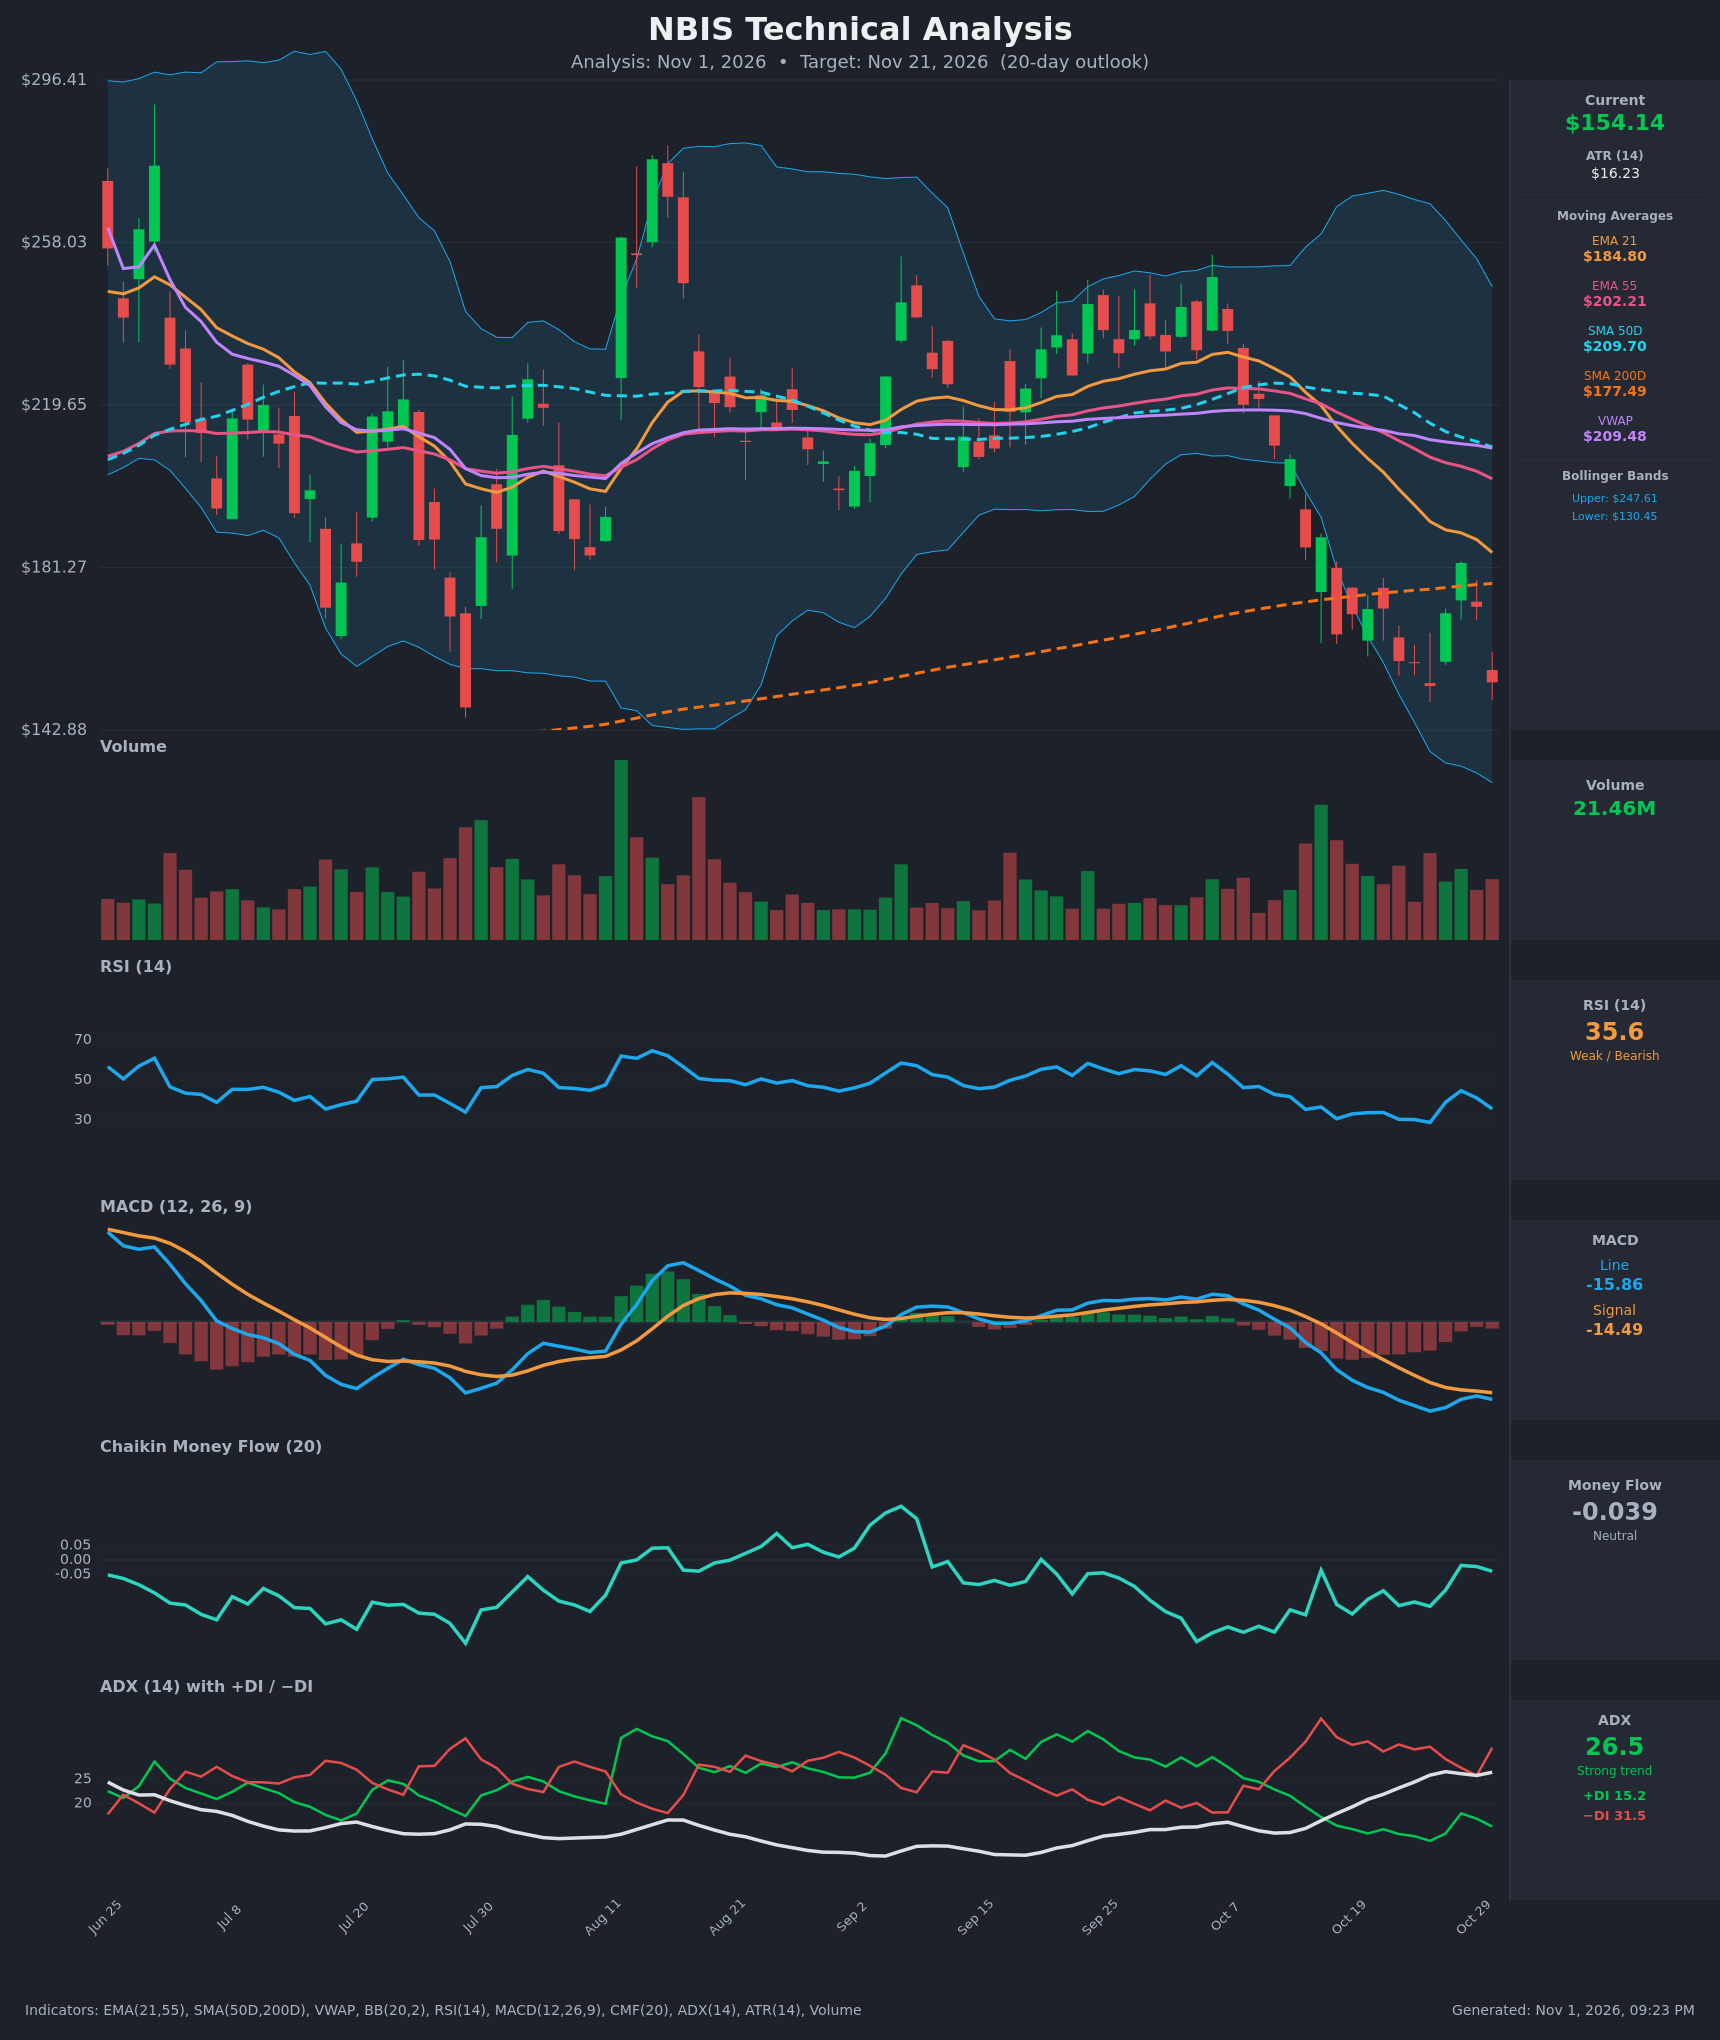
Analysis
TECHNICAL INDICATORS
- RSI (14): 35.58, down from 44.7 on Oct 28 and just above oversold (<30). It touched 28.8 on Oct 26 and bounced, but the bounce failed and momentum is turning down again. [Bearish]
- 20 EMA (EMA 21): $184.80, with price at $154.14 about 16.6% below it. The EMA is falling steeply and acts as overhead resistance. EMA 21 is also below EMA 55 ($202.21), a bearish alignment. [Bearish]
- MACD: Line -15.86, signal -14.49, histogram about -1.4. The line has been below the signal since mid-October, and the Oct 27-29 histogram improvement reversed on Oct 30 when the line dropped back below the signal. Both lines are deeply negative. [Bearish]
- Bollinger Bands (20): Upper $247.61, lower $130.45, midline about $189. Price is in the lower half, about 20% of the way from the lower band to the upper. The bands are wide, showing high volatility after the October breakdown. Price sits well below the midline, and the lower band is a possible downside magnet or bounce zone. [Bearish]
- CMF (20): -0.039, in the neutral zone (between -0.05 and +0.05). It has recovered from about -0.25 in early October, so selling pressure has eased, but money flow has not turned positive. [Neutral]
- ADX (14): 26.5 and rising, so the trend is strong. −DI (31.5) is well above +DI (15.2), putting the bears firmly in control, and −DI re-expanded on Oct 30. [Strong Trend – Bearish]
- Volume: 21.46M, near average. The big volume bars came on the October breakdown (red days), and the recent bounce was on lighter volume. That suggests distribution on the way down and weak conviction in the rebound. [Mildly Bearish]
DIVERGENCES & TRENDS
- Moving average structure: Price is below EMA 21, EMA 55, SMA 50D ($209.70) and VWAP ($209.48). EMA 21 crossed below EMA 55 around Oct 15 (bearish crossover). SMA 50D ($209.70) is still above SMA 200D ($177.49), so no death cross yet, but the gap is narrowing quickly.
- Price vs. SMA200D: Price at $154.14 is now about 13% below the SMA200D, which breaks the long-term uptrend support. The SMA200D at about $177 is now overhead resistance.
- RSI: The Oct 26 low of 28.8 came with price at $153.27. The Oct 30 close of $154.14 is almost the same price, but RSI is higher at 35.6. That is a mild bullish divergence, a double-bottom attempt, though RSI has not confirmed with a bounce above 50.
- MACD: Both lines are deeply negative and have been making new lows, with a bearish re-cross on Oct 30. This is consistent with a downtrend, not a reversal.
- DI/ADX: −DI crossed back above +DI on Oct 30 after nearly converging on Oct 29 (25.8 vs 25.8). The bounce attempt failed.
- Trend: Lower highs ($210 to $188 to $182) and lower lows are in place. The failed bounce at $182 into the EMA 21 zone confirms the downtrend.
CHART PATTERNS
- Bearish breakdown from a range: From August to early October price consolidated roughly between $210 and $250. The October breakdown below the range and below the $177 SMA200D resembles the target move of a Bearish Triple Top / Double Top, which projects a decline roughly equal to the range height.
- Possible Bullish Double Bottom (low confidence): The Oct 26 low ($153.27) and the Oct 30 close ($154.14) form a tentative double bottom, with a neckline around $182. It needs a close above $182 to confirm, and that has not happened.
- Bearish flag/pullback: The Oct 27-28 bounce to $182 and the rollover look like a bearish flag or dead-cat bounce. A break below $153 would project a measured move toward $130 (the lower Bollinger Band) and possibly the mid-$120s.
POTENTIAL SCENARIOS
- Scenario 1: Bearish Breakdown Continuation — Price breaks the $153 double-bottom support and continues toward the lower Bollinger Band as −DI dominates and ADX rises. Trigger: close below $153. Target: $130-$138, with an extension to about $125. Invalidation: daily close above $172. (50% probability)
- Scenario 2: Neutral/Bullish Relief Bounce, Then Fade — The tentative double bottom and RSI divergence hold, producing a bounce to the $170-$182 zone (EMA 21 and a gap fill) that then stalls below the SMA200D. Trigger: hold above $150 with RSI back above 40. Target: $170-$180. Invalidation: close below $148. (35% probability)
- Scenario 3: Bullish Double-Bottom Reversal — Price reclaims $182 with rising volume, MACD turns up, and the move extends toward the $200 EMA 55 area. Trigger: close above $182 on strong volume. Target: $200-$205. Invalidation: rejection at $182 and a close back under $165. (15% probability)
PRICE TARGETS
For the 20-day timeframe (Nov 21, 2026), the range width should be about 8-12% of price (about $12-$18), or somewhat wider given elevated volatility (ATR $16.23, about 10.5% of price). I use roughly 22% to reflect the high volatility, which is wider than the formula's guide but consistent with the high-ATR conditions.
- Target Price: $144.00 (about 6.6% below current)
- Expected Range: $124.00 to $170.00 (width $46, about 30% of price)
- Key Levels: Support at $130.45 (lower Bollinger Band; near-term pivot at $153), Resistance at $171.57
Self-check: the width is $46, about 30% of the $154.14 price. This is above the 14-21 day guide of 8-12% (it is closer to a 61-180 day width), justified by ATR of about 10.5% of price and the wide Bollinger Bands, and it is much wider than a 2-3 day range.
OVERALL BIAS
OVERALL BIAS: BEARISH - Price is below all key moving averages and the SMA200D, −DI (31.5) dominates +DI (15.2) with ADX at 26.5, and MACD remains below its signal line. The mild RSI divergence is the main risk to this view, but it needs a reclaim of $182 to confirm.
This is educational analysis and not financial advice.