NFLX 20-day bearish forecast — Nov 1, 2026
- Bias: Bearish
- Timeframe: 20 days (made Nov 1, 2026, target date Nov 20, 2026)
- Price at analysis: $62.08
- Price target: $59.50
- Expected range: $54.00 – $65.50
- Result: Pending — graded after the close on Nov 20, 2026
Get a free AI analysis of NFLX today
Analysis
TECHNICAL INDICATORS
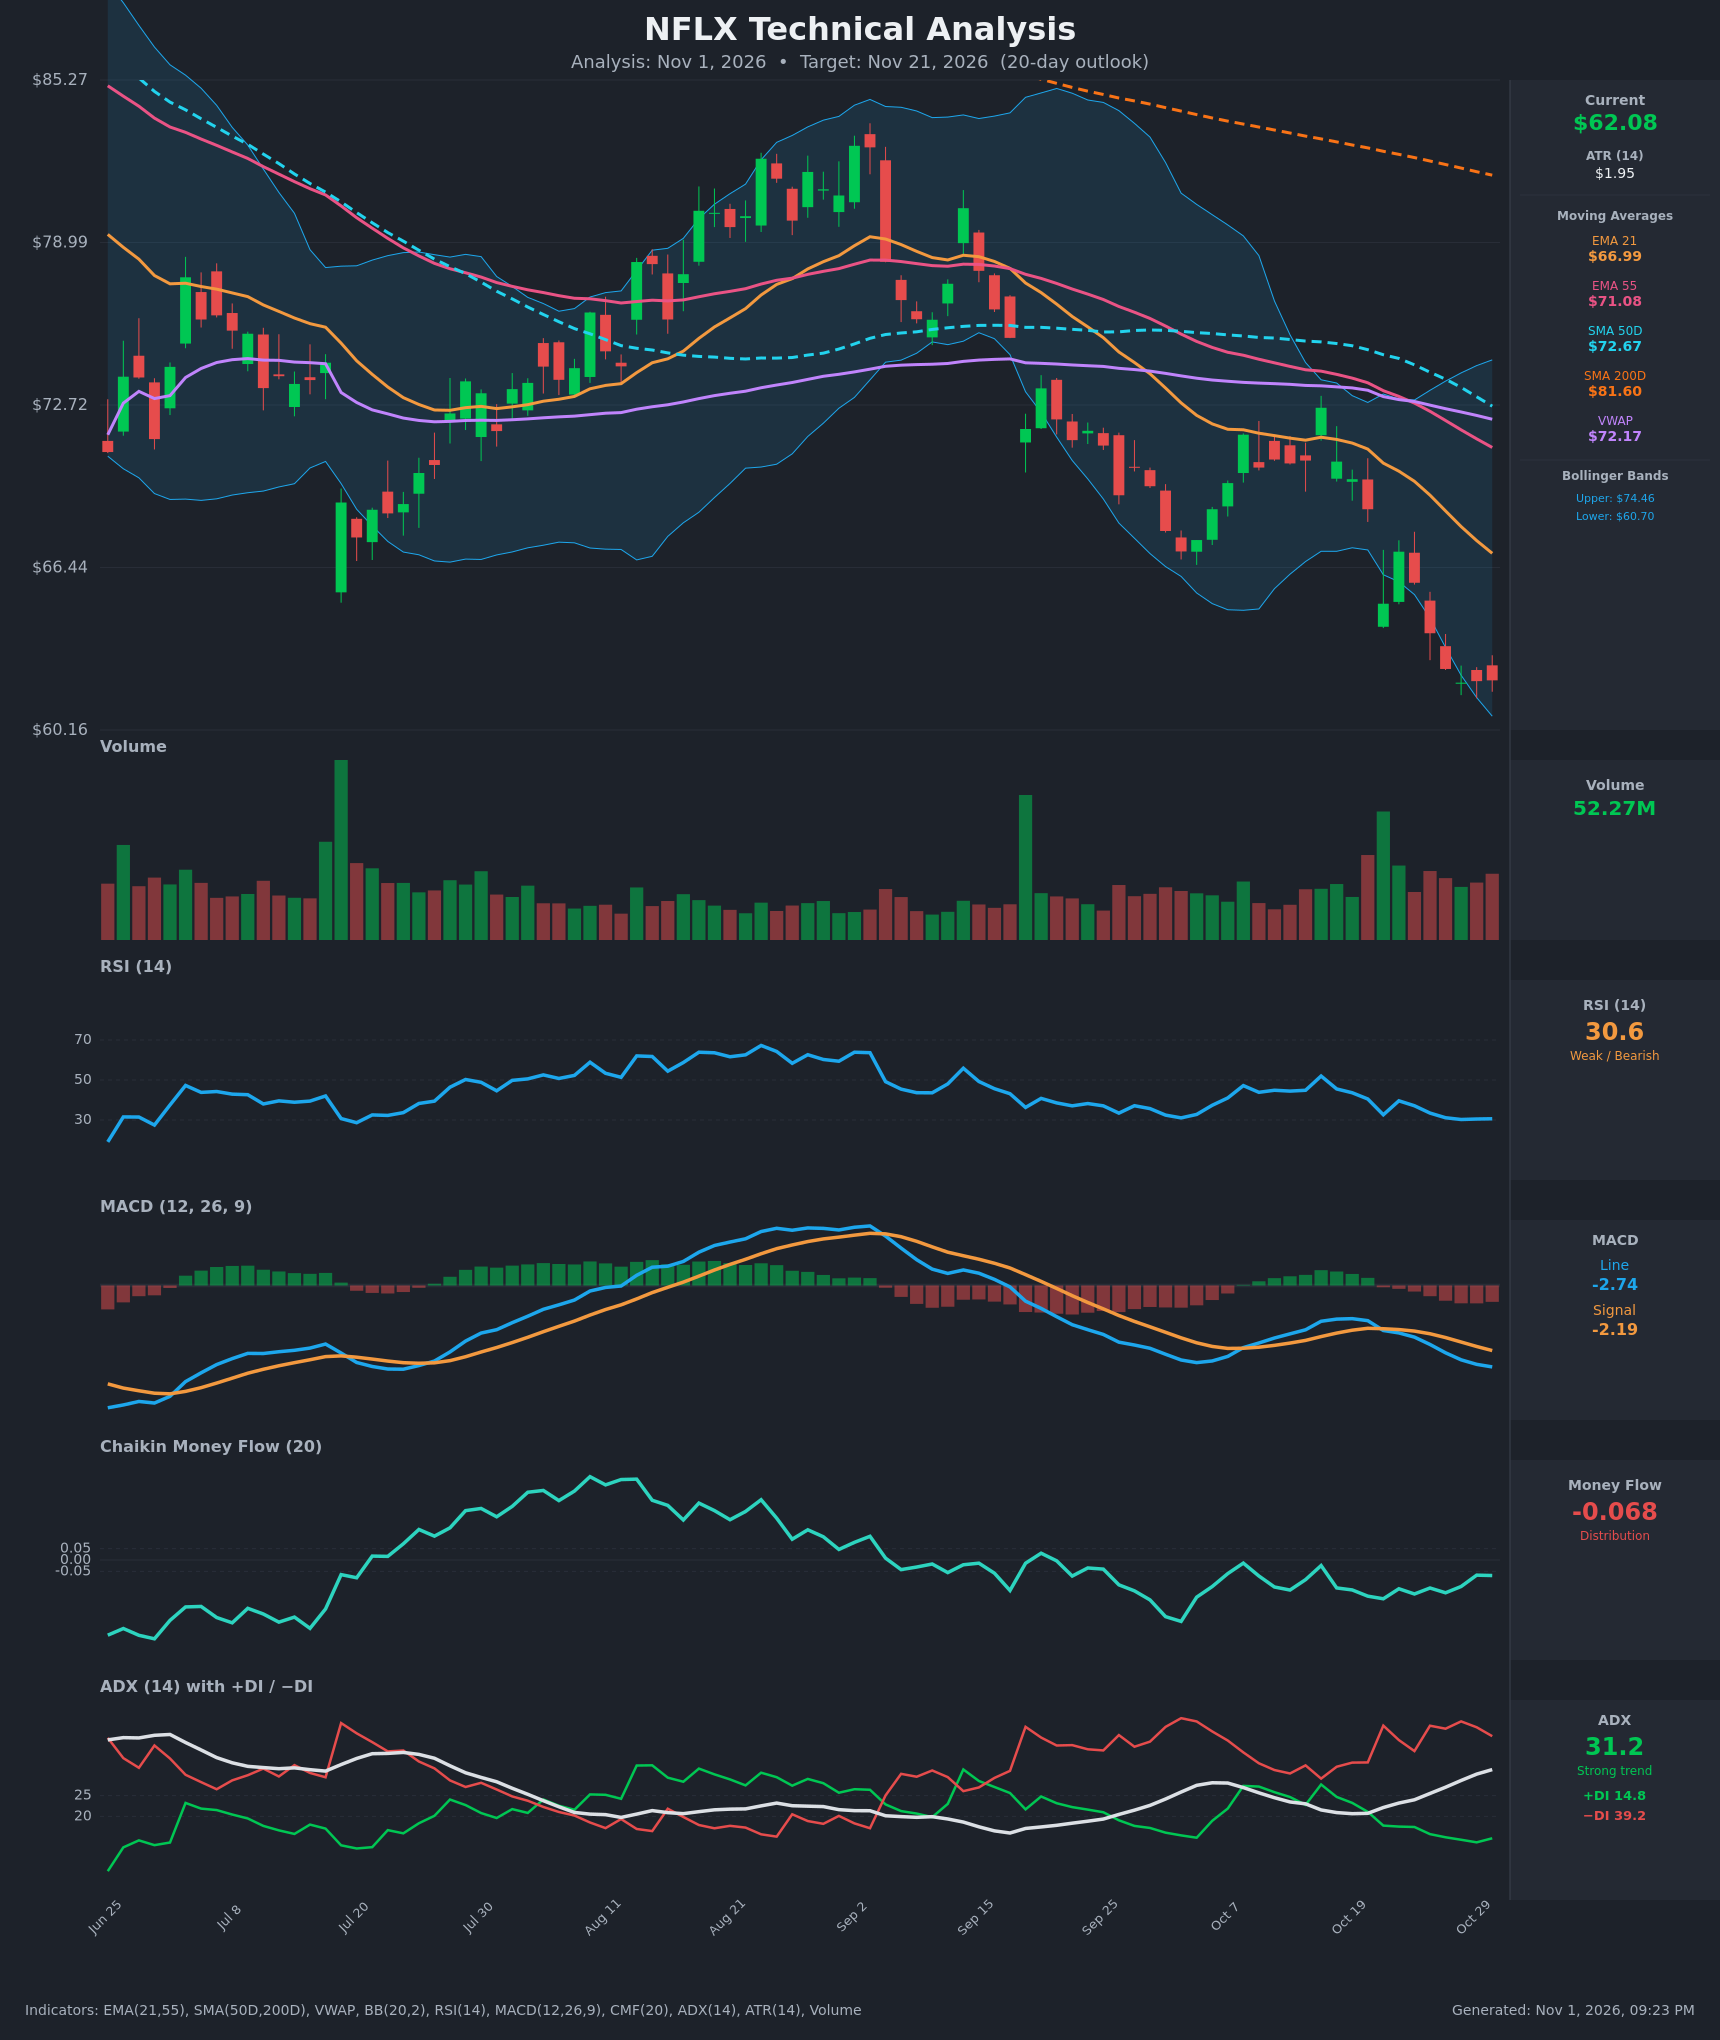
- RSI (14): 30.62, hugging the oversold threshold. It has been pinned at 30-31 for four sessions (30.3 → 30.6) and has not made a bullish turn yet. Momentum is weak but selling is decelerating. [Bearish]
- 20 EMA: The 21 EMA is at $66.99 and falling steeply, about 7.9% above price at $62.08. It acts as overhead resistance, and the EMA21 < EMA55 ($71.08) < SMA50 ($72.67) stack is fully bearish. [Bearish]
- MACD: Line -2.74 is below the signal at -2.19, with the gap widening (histogram about -0.55 and getting more negative). The bearish crossover occurred around Oct 21 and has strengthened since, with no sign of a momentum turn. [Bearish]
- Bollinger Bands (20): Upper $74.46, lower $60.70. Price at $62.08 sits in the lower band, roughly 10% of the way up the range, and the bands are wide, so volatility is elevated. The recent wick pierced the lower band. This is a "walking the band" downtrend, though a mean-reversion bounce toward the midline (about $67.6) is possible. [Bearish]
- CMF (20): -0.068, below the -0.05 threshold. It has been in the -0.07 to -0.17 range for the entire 15-bar window, which signals persistent distribution, although it has improved slightly from -0.17. [Distribution]
- ADX (14): 31.2 and rising (from 20.7 on Oct 19), with -DI at 39.2 well above +DI at 14.8. This is a strong, accelerating downtrend with bears firmly in control. [Strong Trend – Bearish]
- Volume: 52.27M. Heavy-volume red candles on the breakdown (the Oct 21 and Oct 26 selloff) show conviction on down moves. The last few sessions show smaller candle bodies, suggesting some selling exhaustion, but there is no capitulation spike or reversal volume yet. [Bearish with early exhaustion]
DIVERGENCES & TRENDS
- No bullish divergence yet: Price is making new lows ($62.08 vs. $65.04 on Oct 21) and RSI is flat near 30 rather than making a higher low. MACD is also making lower lows. RSI at 30.3-30.6 against the lower closes is only a mild stabilization.
- Moving averages: A death cross has already happened (SMA50 $72.67 < SMA200 $81.60). The gap is widening, and price is 24% below SMA200, so the long-term trend is firmly down. EMA21 is accelerating lower and will likely confirm bearish control further.
- VWAP: Price is $10 below VWAP ($72.17), which indicates sustained selling pressure.
- Trend in DI/ADX: -DI has been above +DI for the entire window, and the gap is widening. ADX is climbing, which means trend strength is increasing.
- Stabilization: The last 4 candles are small-bodied with a doji-like pattern at $62, so near-term selling is slowing. A relief bounce is plausible but needs confirmation.
CHART PATTERNS
- Primary pattern – Bearish continuation / downtrend channel: Price made a lower high at around $73 (Oct 15), then a sharp breakdown through the $65 and $63 area. This is the "Bearish Pennant / Flag" continuation structure from the diagram, in which a consolidation near $70-72 broke downward. The measured move targets roughly $58-60.
- Larger structure: Peak at about $83 (early Sep) followed by lower highs resembles a Bearish Head and Shoulders-type topping and distribution structure. The failed attempt near $73 could be the right shoulder, and the breakdown below the neckline (about $65-66) projects toward the high $50s.
- Counter-pattern: The tiny-bodied candles at the lower Bollinger Band and RSI ~30 could be the beginning of a Bullish Falling Wedge-style basing, but there is no breakout yet, so this is only speculative.
POTENTIAL SCENARIOS
- Scenario 1: Bearish Trend Continuation — The strong downtrend (ADX rising, -DI dominant, MACD widening below the signal) persists, with only weak bounces failing at the falling 21 EMA. Trigger: close below $60.70 (lower BB / recent low area). Target: $57.50-$58.50, with extension to $56. Invalidation: daily close above $67 (EMA21). (50% probability)
- Scenario 2: Bullish Oversold Relief Bounce — RSI at 30 with a tiny-bodied basing pattern prompts mean reversion toward the BB midline, which would still be a lower high in a bear trend. Trigger: close above $64.50 on rising volume with RSI above 35. Target: $66.50-$67.50 (EMA21 / BB midline). Invalidation: close below $60.50. (32% probability)
- Scenario 3: Neutral Basing Range — Price chops sideways between $60.50 and $65 as selling exhausts but buyers do not commit. Trigger: low-volume, narrow-range days with ADX flattening. Target: $61-$64. Invalidation: close outside $60-$66. (18% probability)
PRICE TARGETS
- Target Price: $59.50 (20-day)
- Expected Range: $54.00 to $65.50 (width $11.50 ≈ 18.5% of the current price, appropriate for a ~20-day horizon given elevated volatility and a strong-trend backdrop)
- Key Levels: Support at $60.70 (lower Bollinger Band / recent low), Resistance at $66.99 (EMA21, with minor resistance at $65.04)
OVERALL BIAS
OVERALL BIAS: BEARISH - ADX of 31 is rising with -DI (39.2) far above +DI (14.8), MACD is widening below its signal, price sits below every moving average (including a death cross), and CMF shows persistent distribution. RSI near 30 raises the risk of a relief bounce, but nothing confirms a reversal yet.
This is educational analysis and not financial advice.