NVDA 20-day bearish forecast — Nov 1, 2026
- Bias: Bearish
- Timeframe: 20 days (made Nov 1, 2026, target date Nov 20, 2026)
- Price at analysis: $204.64
- Price target: $199.00
- Expected range: $190.00 – $212.00
- Result: Pending — graded after the close on Nov 20, 2026
Get a free AI analysis of NVDA today
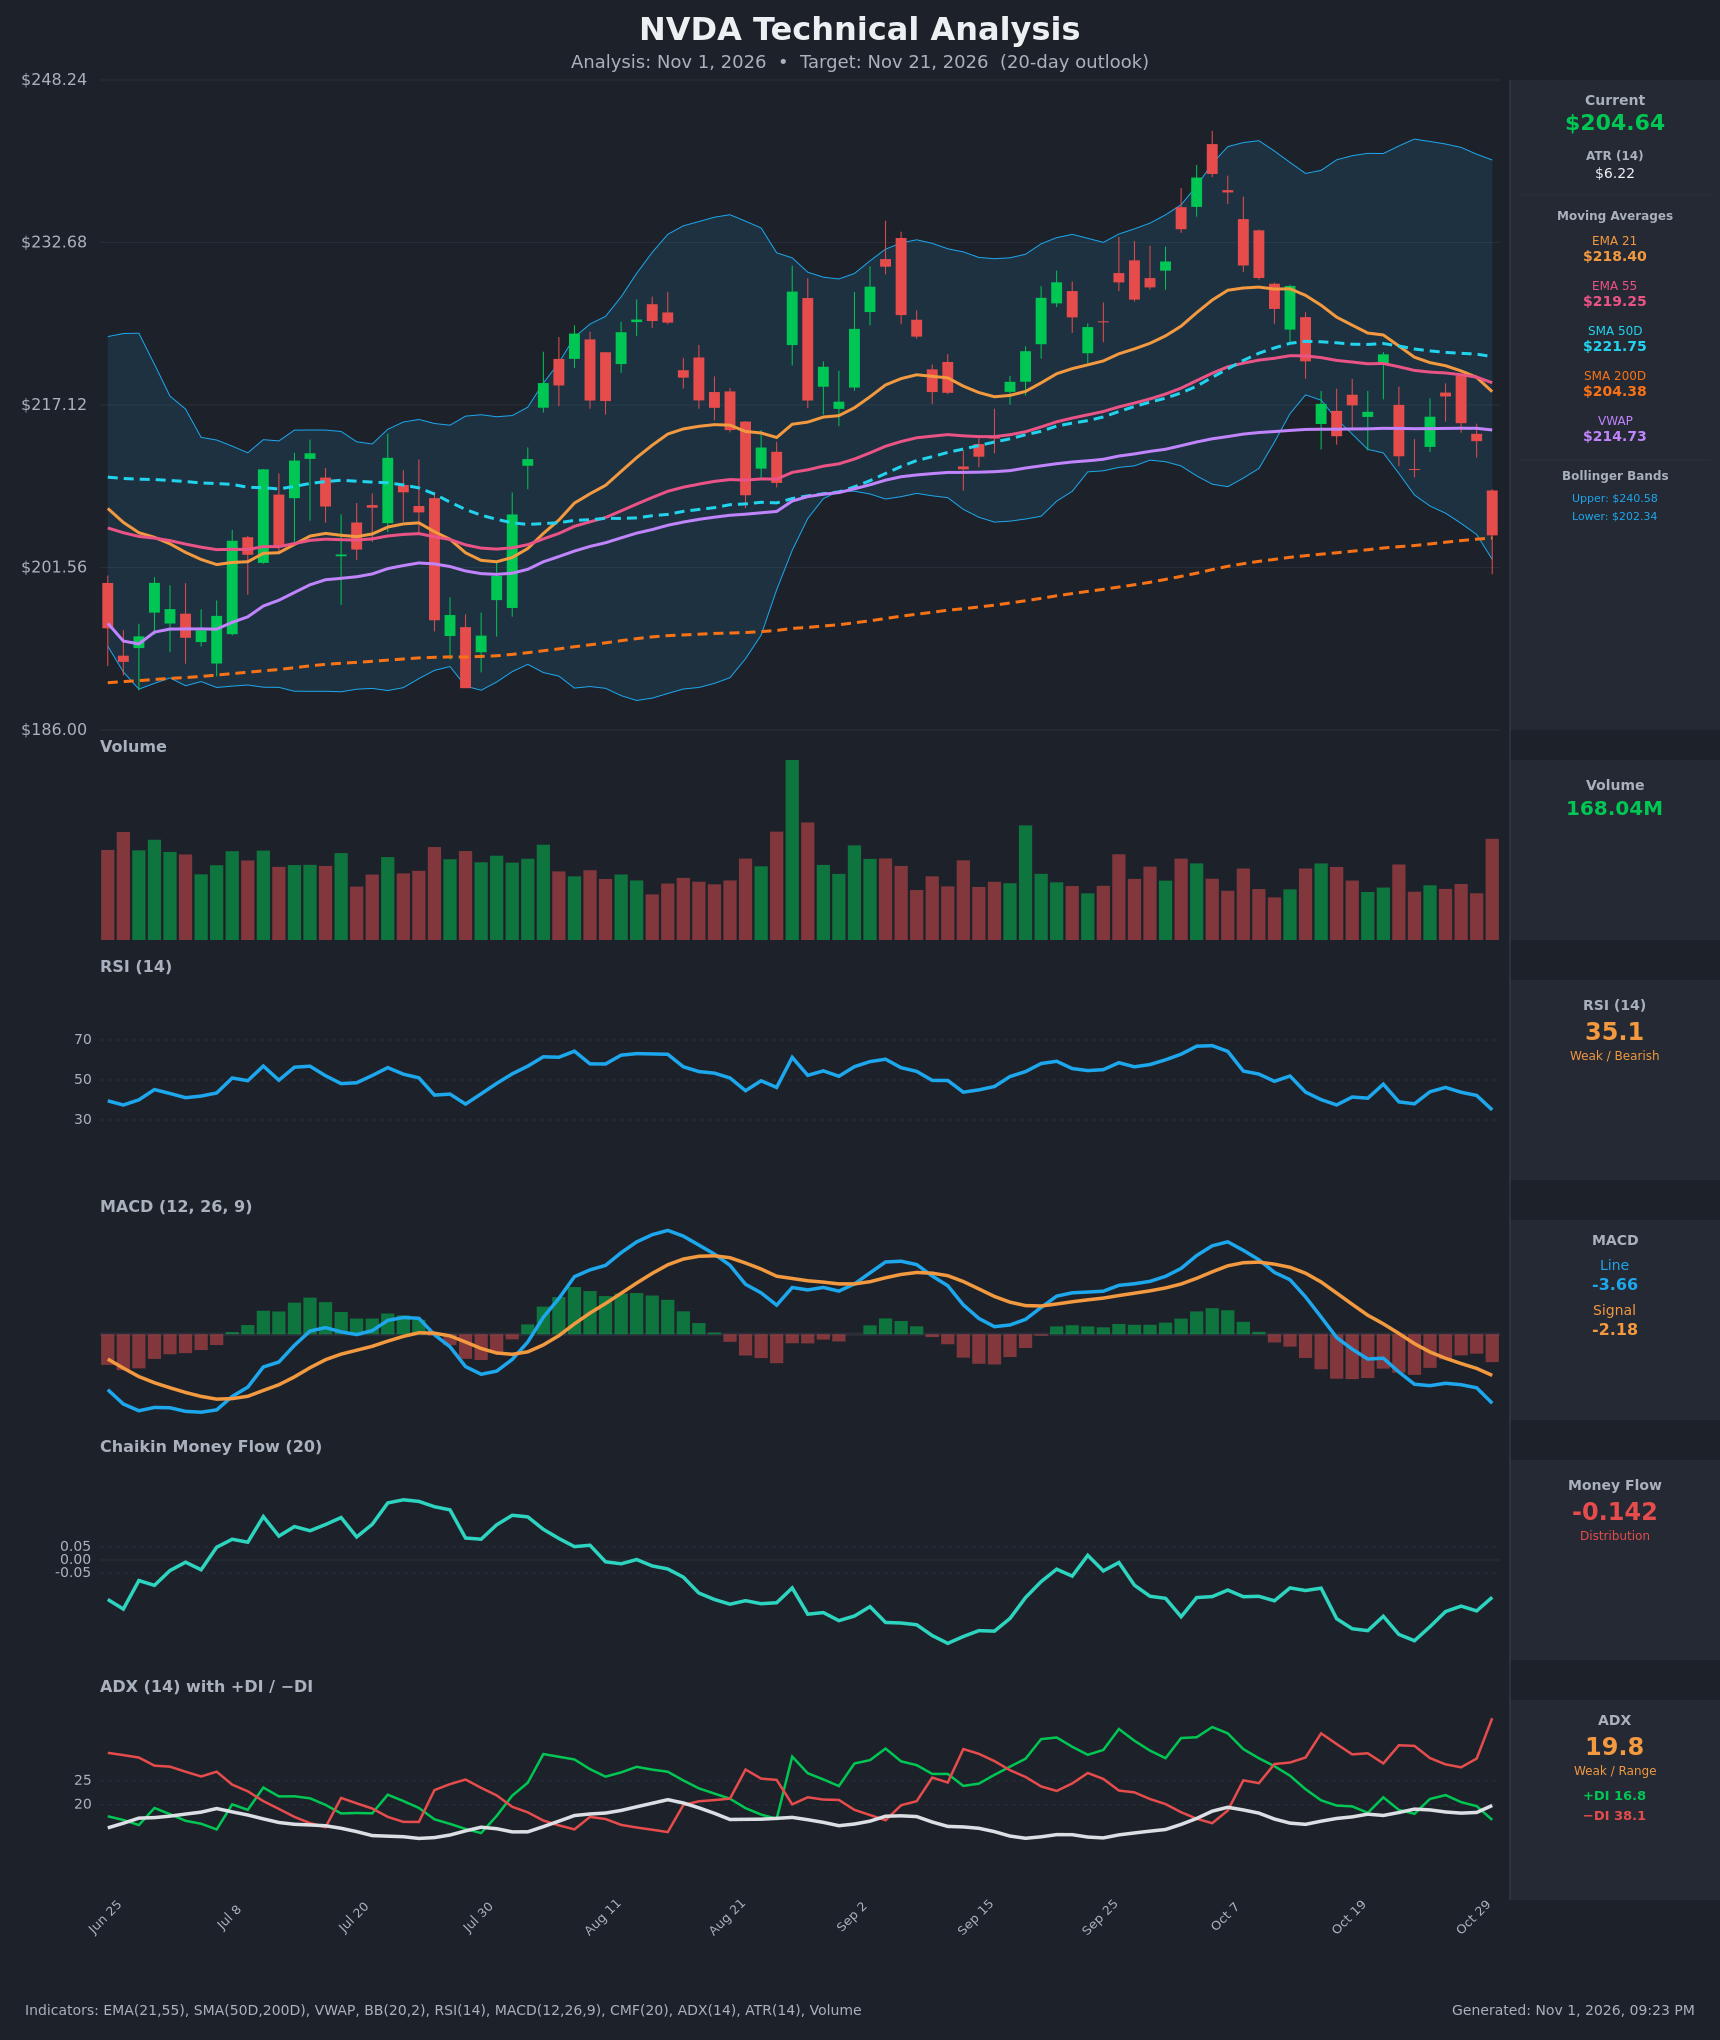
Analysis
TECHNICAL INDICATORS
- RSI (14): 35.06, down from about 66 in early October and approaching the 30 oversold line. Momentum is clearly falling, with lower highs on each bounce (47.9 on Oct 21, 46.3 on Oct 27). It is not yet oversold, so there is room to fall further. [Bearish]
- 20 EMA: The chart shows EMA 21 at $218.40, and price at $204.64 is about 6.3% below it. EMA 21 has crossed below EMA 55 ($219.25) and is sloping down, so the average now acts as overhead resistance. [Bearish]
- MACD: Line at -3.66 is below the signal at -2.18. The bearish crossover happened on Oct 23, and the histogram is widening negative. Both lines are below zero and still falling. [Bearish]
- Bollinger Bands (20): Upper $240.58, lower $202.34. Price at $204.64 is hugging the lower band, with only $2.30 of room. The bands are narrowing from the earlier expansion, and the last candle is a long red bar that probed the lower band. This is a stretched, oversold setup, but walking the band is common in downtrends. [Bearish]
- CMF (20): -0.142, below the -0.05 threshold. It has been negative for the whole recent stretch, with a trough near -0.31 on Oct 23. Selling pressure dominates, though the reading has improved slightly from the low. [Distribution]
- ADX (14): 19.8, with +DI 16.8 and −DI 38.1. ADX is low but rising, from 15.9 to 19.8. −DI is far above +DI and widening, so the move down is directional and trend strength is only just building. [Weak but strengthening trend, bearish direction]
- Volume: 168.04M on the latest bar, the highest in the recent window and well above the average of recent sessions. A heavy-volume breakdown candle suggests either distribution or capitulation. The red close favors continued selling pressure. [Bearish, possible capitulation]
DIVERGENCES & TRENDS
- No bullish RSI or MACD divergence yet. Both are making new lows alongside price, so momentum confirms the decline.
- The Oct 7 peak (~$240) to Oct 30 shows a lower-high, lower-low sequence. Price has fallen about 15% from the peak.
- EMA 21 has crossed below EMA 55, a bearish short-term crossover. SMA50D ($221.75) is still above SMA200D ($204.38), so there is no death cross, but the gap is narrowing.
- Price at $204.64 sits right on SMA200D ($204.38), the key long-term support. The close is only $0.26 above it.
- Price is below VWAP ($214.73), which shows sellers in control.
- The MACD bearish crossover and the −DI dominance are fresh and still extending.
CHART PATTERNS
- Bearish Head and Shoulders / Double Top (loose): The Oct 7 high around $240 followed by a lower high near $228 resembles a topping structure. The breakdown through the $210-212 shelf supports a reversal reading.
- Support test: Price is sitting on SMA200D and the lower Bollinger Band, a confluence zone near $202-204. A decisive break of this zone would open the next leg down toward the $186-195 consolidation base from July-August.
- Measured move: The top-to-neckline height of roughly $28-30 projected from a ~$210 break gives a theoretical target near $180-182, though a 20-day horizon likely reaches only part of it.
- The pattern is not fully clean, so confidence in it is moderate.
POTENTIAL SCENARIOS
- Scenario 1: Bearish Breakdown Below the 200-Day — The heavy-volume close at the SMA200D and lower band leads to a decisive break, with bears controlling via −DI and negative CMF. Trigger: daily close below $202 (the lower band and SMA200D area). Target: $190-195, with an extension to $186. Invalidation: daily close back above $214 (VWAP). (50% probability)
- Scenario 2: Bullish Oversold Bounce off the 200-Day — The SMA200D holds, RSI near 30 prompts a relief rally, and price retraces toward the EMAs. Trigger: reclaim of $210 on a daily close with lower selling volume. Target: $214-219 (VWAP and the EMA 21/55 cluster). Invalidation: close below $200. (35% probability)
- Scenario 3: Neutral Chop Around the 200-Day — Price consolidates between $198 and $212 while the indicators reset. Trigger: failure to break either side. Target: $204-208. Invalidation: a close outside $198-$214. (15% probability)
PRICE TARGETS
For the 20-day timeframe, the range width should be about 8-12% of price. Range: $190.00 to $212.00 gives $22 width, or 10.8% of $204.64. This passes the self-check.
- Target Price: $199.00 (20 days)
- Expected Range: $190.00 to $212.00
- Key Levels: Support at $202.34 (lower Bollinger Band, with SMA200D at $204.38 nearby), Resistance at $214.73 (VWAP)
The support level sits at the lower band, about 1.1% below the current price. If it breaks, the next support is $195, then $186.
OVERALL BIAS
OVERALL BIAS: BEARISH - MACD is in a bearish crossover below zero, −DI (38.1) is far above +DI (16.8), CMF shows distribution, and price is below all key moving averages and VWAP on heavy volume. The 200-day SMA is the last line of defense, and a break should extend the decline, even though RSI near 30 leaves room for a bounce.
This is educational analysis and not financial advice.