NOK 20-day bearish forecast — Nov 1, 2026
- Bias: Bearish
- Timeframe: 20 days (made Nov 1, 2026, target date Nov 20, 2026)
- Price at analysis: $8.56
- Price target: $8.25
- Expected range: $7.85 – $8.80
- Result: Pending — graded after the close on Nov 20, 2026
Get a free AI analysis of NOK today
Analysis
TECHNICAL INDICATORS
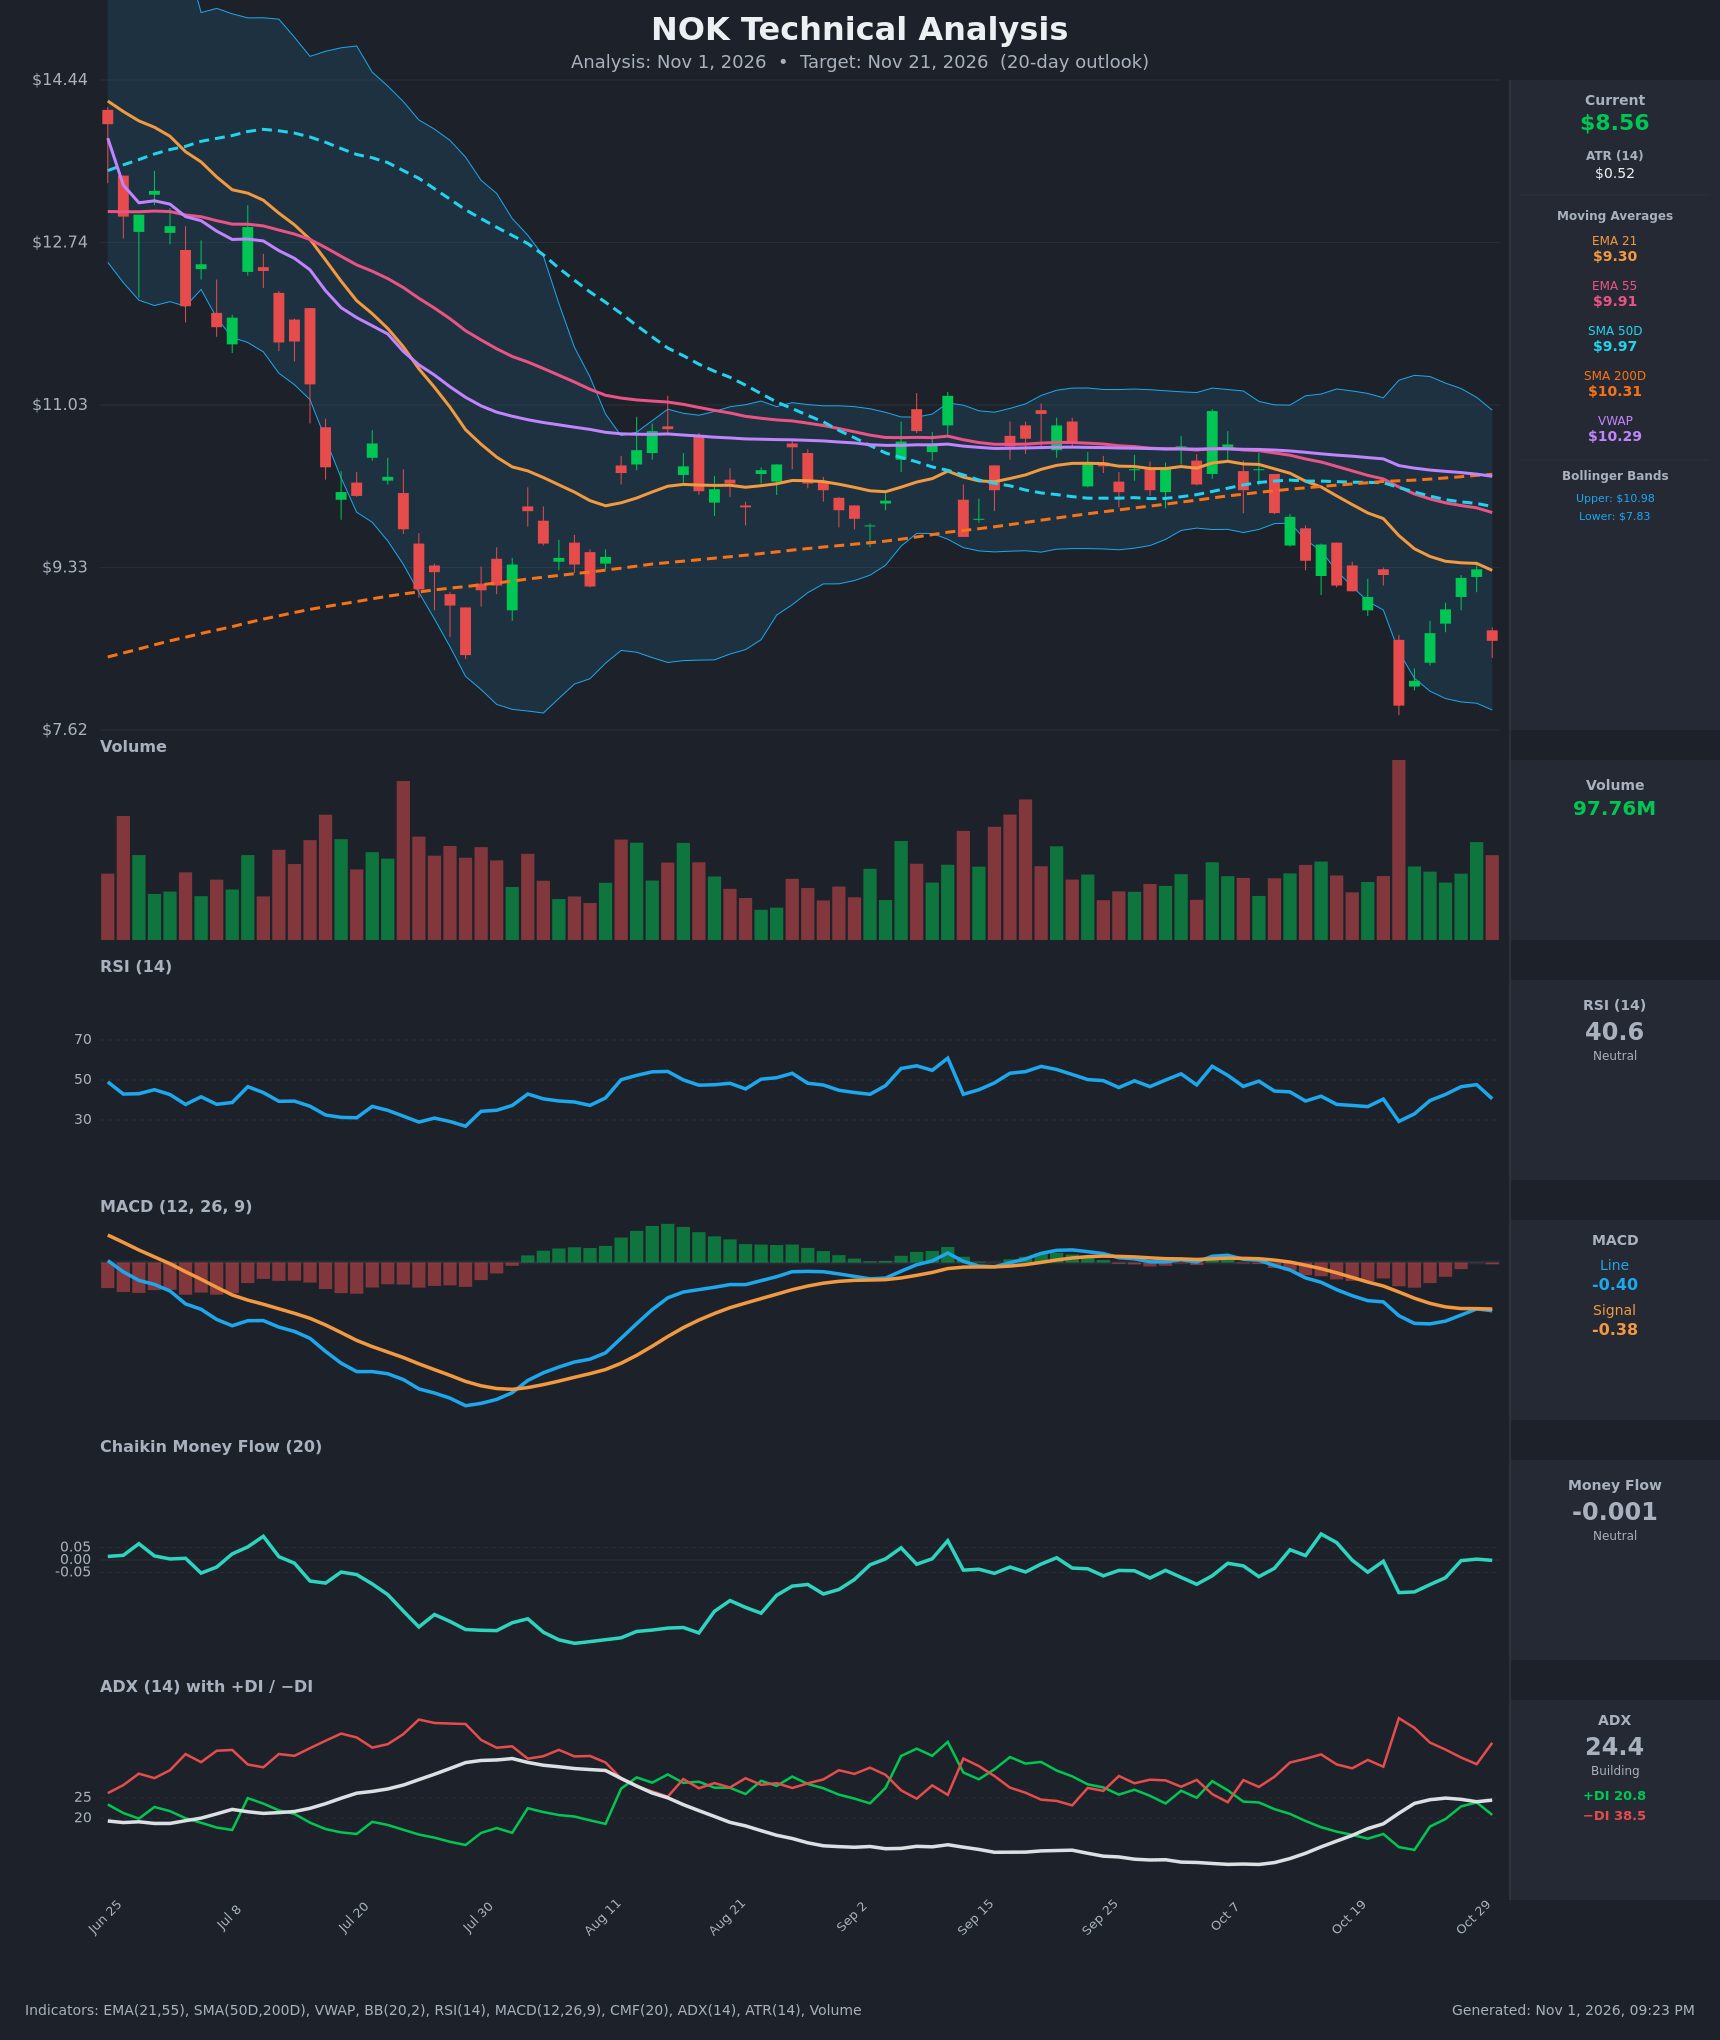
- RSI (14): 40.6, down from 47.7 on Oct 29 after the 8% drop on Oct 30. It sits below 50 and well above oversold (30), so there is room to fall further. The October low was 29.3 on Oct 22. [Bearish]
- 20 EMA: The supplied value is the EMA 21 at $9.30. Price at $8.56 is about 8% below it, and the Oct 29 bounce stalled right under it ($9.31 close vs. $9.37 EMA). EMA21 is below EMA55 ($9.91), so the short-term trend is down and the EMA21 is acting as resistance. [Bearish]
- MACD: Line -0.3955 is below signal -0.3813, a fresh bearish re-cross on Oct 30 after the lines had nearly converged on Oct 29. Both are negative and the histogram has flipped slightly negative. The bounce did not produce a bullish cross. [Bearish]
- Bollinger Bands (20): Bands run $7.83 to $10.98. Price at $8.56 is in the lower quarter of the bands, which have widened after the Oct 22 selloff. The bounce failed well short of the midline (~$9.4), and a walk back toward the lower band at $7.83 is plausible. [Bearish]
- CMF (20): -0.001, which is neutral (between ±0.05). It has recovered from -0.13 on Oct 22 but never turned into accumulation, so there is no buying pressure behind the bounce. [Neutral]
- ADX (14): 24.4 with −DI 38.5 well above +DI 20.8. ADX is just under the 25 threshold and has been rising since 9 on Oct 12. Bears are clearly in control, and the DI spread (about 18 points) widened on Oct 30. [Strong-ish Trend – Bearish]
- Volume: 97.76M on a red day, above the typical level of recent weeks. The only larger bar was the Oct 22 capitulation bar. Heavy volume on the rejection at the EMA21 suggests sellers are active. [Bearish – distribution on the rejection]
DIVERGENCES & TRENDS
- No clear divergence. RSI made a higher low (29.3 on Oct 22 vs. 40.6 now) but price is only 8% above the low-close area, so this is not a reliable bullish divergence yet. It is a possible setup if price makes a lower low near $7.9 with RSI holding above 30.
- MA structure is bearish. Price is below EMA21 ($9.30), EMA55 ($9.91), SMA50D ($9.97), VWAP ($10.29) and SMA200D ($10.31). SMA50D crossed below SMA200D around Oct 19-20, a death cross, and the gap has since widened.
- MACD. The line rolled over from near-signal on Oct 29 back below it on Oct 30, a bearish cross.
- DI. −DI has stayed above +DI throughout. The +DI rally to 23.9 almost reached −DI on Oct 29 but was rejected sharply.
CHART PATTERNS
- Bearish Flag / Rising Wedge-style bounce (continuation). The sharp drop on Oct 22 ($9.25 to $7.88) formed the pole. The rising series of higher closes through Oct 29 ($9.31) forms the flag. The Oct 30 drop (-8%) looks like a break back down out of the flag. A measured move (pole ≈ $1.37 from the flag top at ~$9.31) points to ~$7.9. A partial move is more realistic within 20 days.
- Bearish context. Price is in a long-term downtrend from $14+ in June and is below the downward-sloping 200D and the flat-to-declining EMAs.
- Support zone. The $7.62-$7.88 area is a possible double-bottom base, which would be bullish only if it holds on a retest.
POTENTIAL SCENARIOS
- Scenario 1: Bearish Flag Breakdown — Price failed at the EMA21 and has broken down from the bounce, with −DI dominance and a bearish MACD cross. Price drifts lower and retests the Oct 22 low zone. Trigger: close below $8.40 on volume. Target: $7.90-$8.25 (lower BB at $7.83). Invalidation: daily close above $9.30 (EMA21). (55% probability)
- Scenario 2: Neutral Choppy Base Between $7.90 and $9.00 — Price holds the Oct 22 low area, RSI stays 35-50 and ADX stays below 25, so price oscillates around $8.50. Trigger: hold above $8.10 with low-volume consolidation. Target: $8.40-$8.80. Invalidation: close below $7.85 or above $9.35. (25% probability)
- Scenario 3: Bullish Relief Rally / Double Bottom — Oversold bounce holds higher low with RSI divergence and price reclaims EMA21. Trigger: close above $9.00 with a bullish MACD cross. Target: $9.30-$9.90 (EMA21, then EMA55). Invalidation: close back below $8.50. (20% probability)
PRICE TARGETS
- Target Price: $8.25 (20-day, Nov 21, 2026)
- Expected Range: $7.85 to $8.80 (width $0.95 ≈ 11.1% of current price, in line with the 14-21 day guidance of ~8-12%)
- Key Levels: Support at $7.88 (Oct 22 close/low area; Bollinger lower band $7.83 just below), Resistance at $9.30 (EMA21, the high of the failed bounce)
OVERALL BIAS
OVERALL BIAS: BEARISH - Price is below every major moving average after a death cross, with −DI (38.5) far above +DI (20.8), a fresh bearish MACD cross, and heavy-volume rejection at the EMA21. The Oct 22-29 bounce looks like a bearish flag, pointing to a retest of the $7.9-$8.3 area.
This is educational analysis and not financial advice.