PLTR 20-day bearish forecast — Nov 1, 2026
- Bias: Bearish
- Timeframe: 20 days (made Nov 1, 2026, target date Nov 20, 2026)
- Price at analysis: $184.11
- Price target: $178.00
- Expected range: $162.00 – $196.00
- Result: Pending — graded after the close on Nov 20, 2026
Get a free AI analysis of PLTR today
Analysis
TECHNICAL INDICATORS
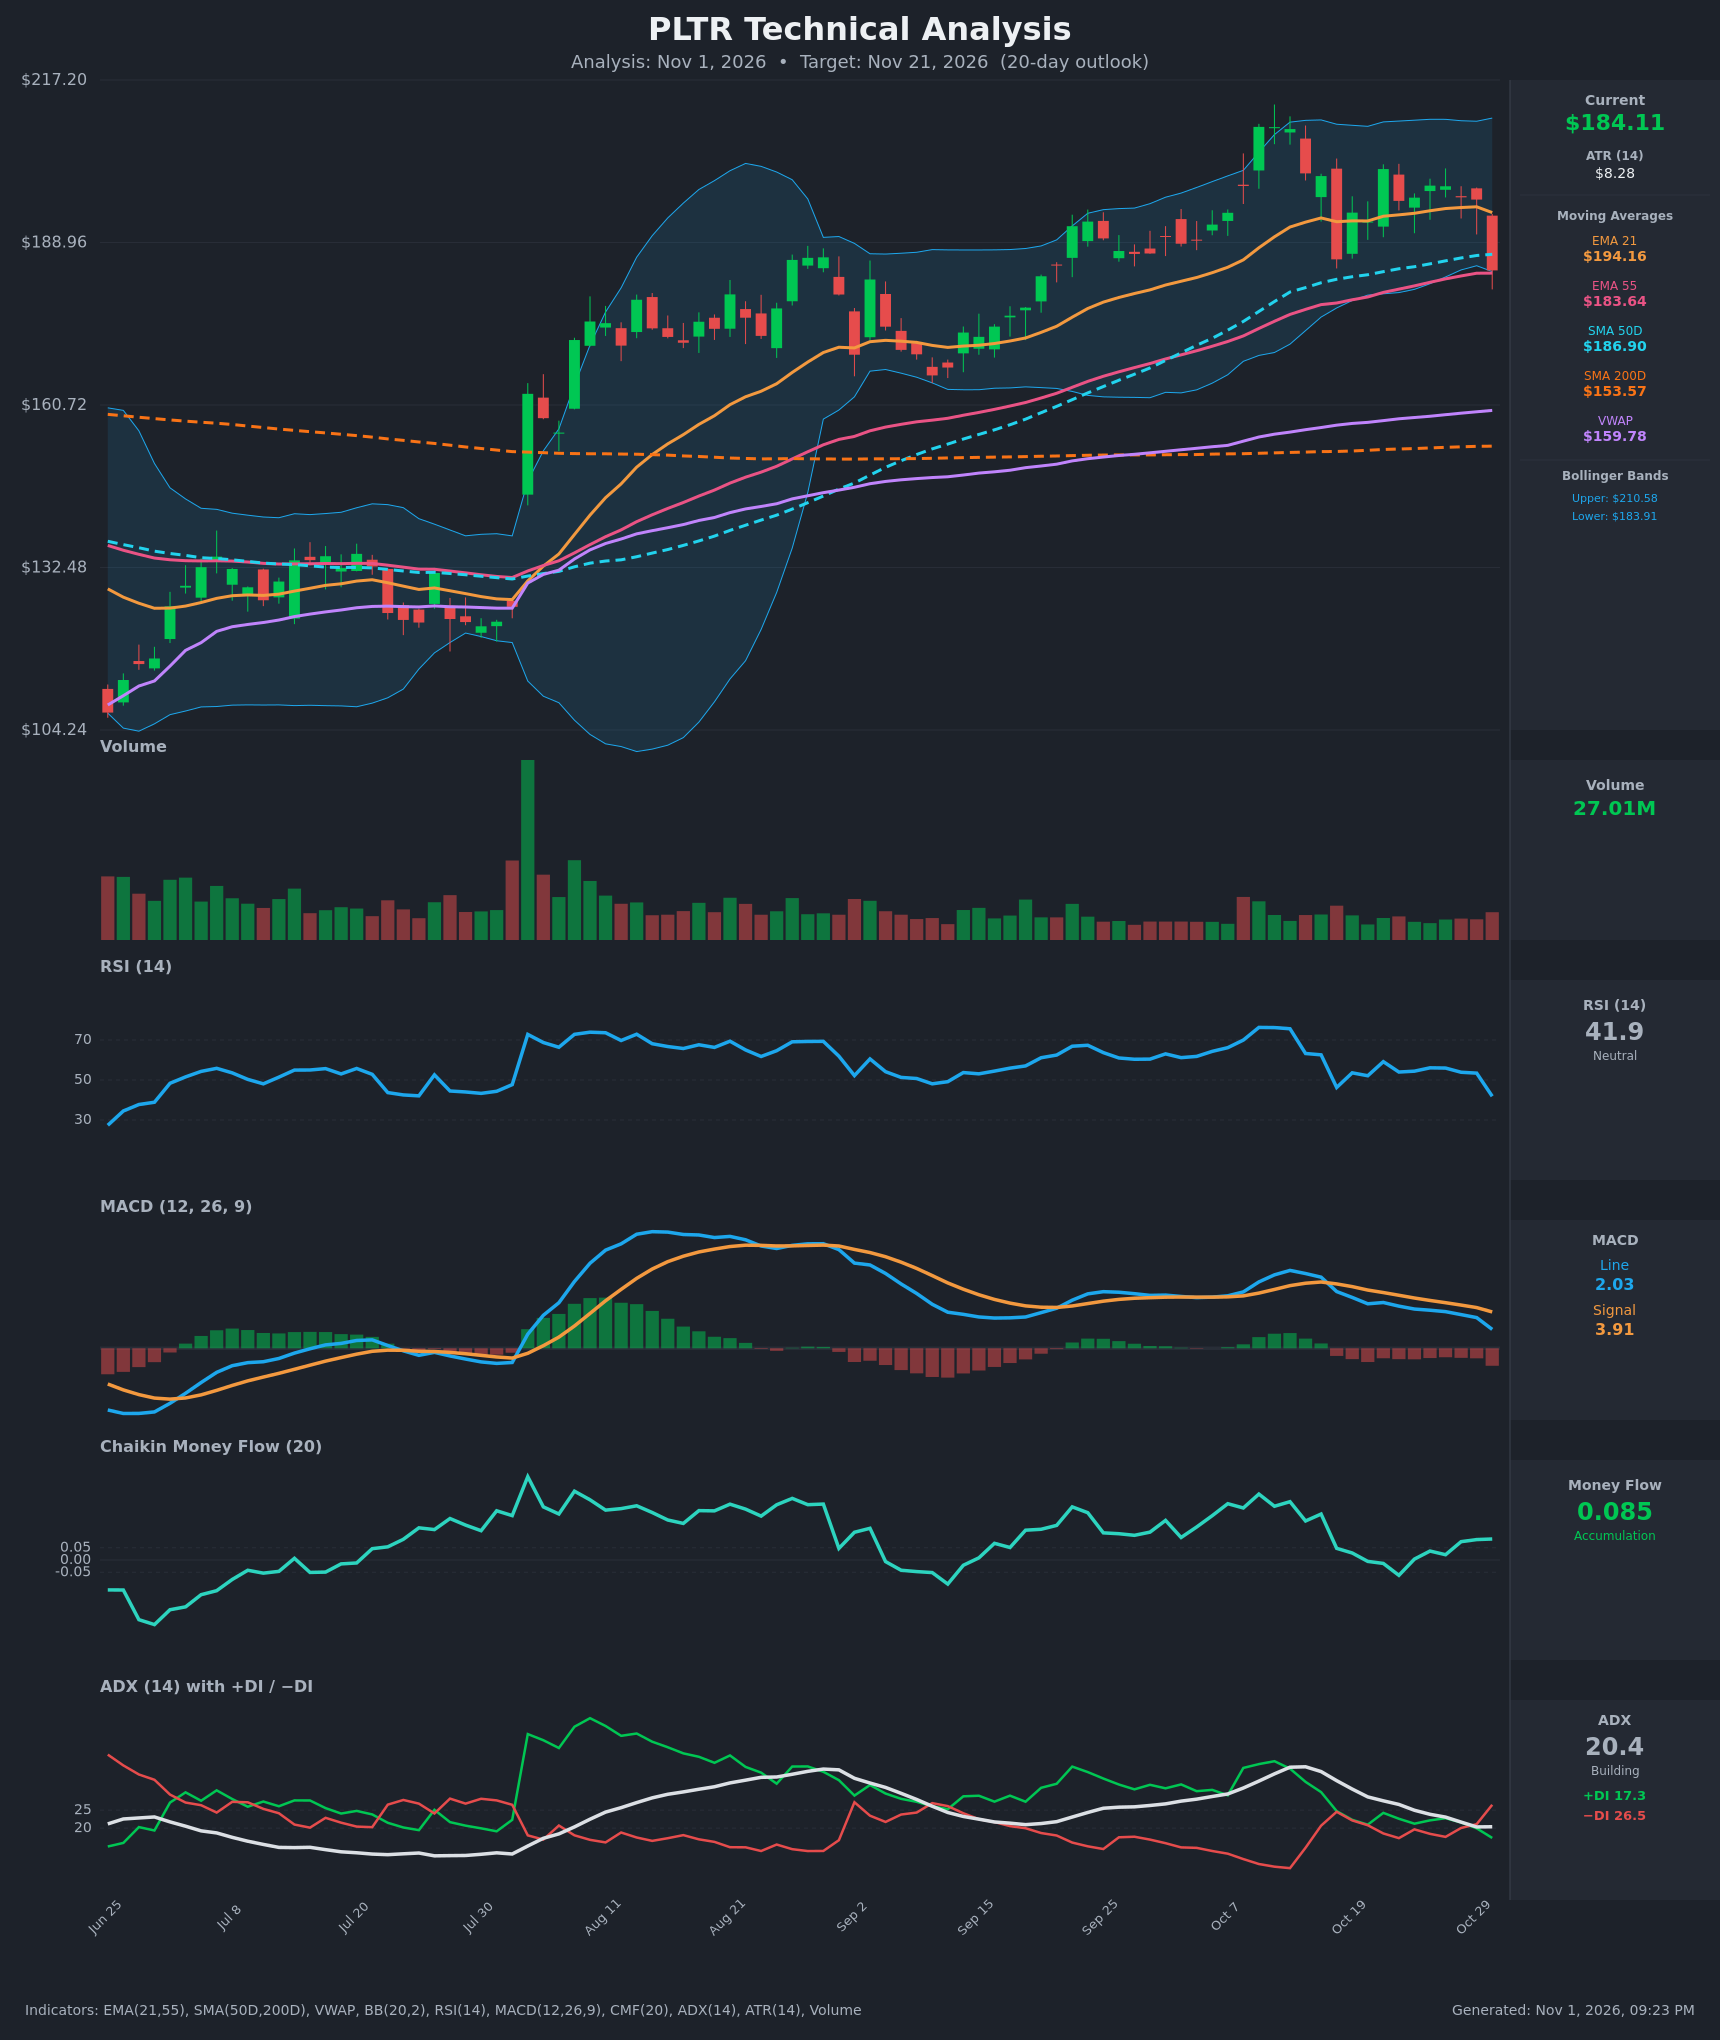
- RSI (14): 41.86, down sharply from 53.4 on the prior bar and from 76 in mid-October. It has dropped below 50 for the first time since Oct 16 and is heading toward 30 without being oversold. Momentum is deteriorating. [Bearish]
- 20 EMA: The 21 EMA is $194.16 and price at $184.11 is about 5% below it, so it acts as overhead resistance. The EMA21 is still above the EMA55 ($183.64), so there is no bearish crossover yet, but the gap has narrowed from about $15 to about $10.5. Price is sitting right on the EMA55, the next support. [Bearish]
- MACD: The line (2.03) is below the signal (3.91) with a negative histogram of about -1.88. The bearish crossover occurred around Oct 16 and the line has been falling steadily since the 8.39 peak on Oct 13. The line is still above zero, so the longer-term trend has not yet turned down. [Bearish]
- Bollinger Bands (20): Upper $210.58, lower $183.91. Price at $184.11 is pinned to the lower band after a $12 one-day drop (-6.3%). The bands are wide, so volatility is elevated. A lower-band tag in a weakening trend can mean continuation, but it also often leads to a mean-reversion bounce toward the midline (~$197). [Neutral]
- CMF (20): 0.085, above the +0.05 threshold, though it has been choppy (about 0 to 0.085 over the past two weeks). The latest high-volume red candle is not yet reflected in the 20-period reading. This is mild accumulation that is fading from the 0.2+ levels of mid-October. [Accumulation]
- ADX (14): 20.4, near the weak-trend threshold and down from 37 in mid-October, so the prior uptrend has lost strength. −DI (26.5) has crossed above +DI (17.3), meaning bears are taking control. ADX is flat but could rise if selling continues. [Weak Trend, bearish tilt]
- Volume: 27.01M on the red breakdown candle, which looks above the recent average. Volume has been subdued during the sideways chop since September. The heavier volume on a down move suggests distribution. [Bearish]
DIVERGENCES & TRENDS
- Price made a high near $209 on Oct 12-13 and has since lower-highed (about $201.72, then $198.84). RSI and MACD both peaked earlier and have fallen further, which is confirming weakness rather than diverging.
- MACD histogram is negative and expanding, and the −DI/+DI crossover is a fresh bearish signal.
- Price has closed below the 21 EMA and is hugging the EMA55 ($183.64) and SMA50 ($186.90). It has now fallen below the SMA50, which is a short-term breakdown, while the SMA200 ($153.57) is far below, so the long-term uptrend is intact (golden cross already in place, SMA50 well above SMA200).
- VWAP ($159.78) is far below price, which shows the broader rally is extended from the average cost basis.
- CMF is still mildly positive, a small bullish divergence against the bearish price and momentum action. It is the main support for a bounce case.
CHART PATTERNS
- Since the early-October peak, price has traded in a range of roughly $185-$210. It has made lower highs and a series of failed rallies at the 21 EMA, which is loosely like a Bearish Head and Shoulders / Double Top shape (peaks near $209 and $201.7, neckline around $184-$186). The breakdown candle through the SMA50 and neckline zone supports this.
- The textbook measured move for a double top is the range height (~$209 − $184 ≈ $25) subtracted from the neckline, which gives about $159-$160. That coincides with VWAP and the Aug-Sep gap area. I would treat it as an extreme target for a 20-day window.
- The pattern is not fully confirmed until price closes decisively below the EMA55 and the $180-$183 support zone.
- A nearer-term bounce could produce a Bearish Flag / retest of the broken $186-$194 area before another leg lower.
POTENTIAL SCENARIOS
- Scenario 1: Bearish Breakdown Continuation — the double-top neckline and EMA55 give way and sellers press, since −DI leads, MACD is falling and volume is rising on the decline. Trigger: daily close below $183 (the EMA55 and lower band). Target: $170-$175, with the extension to $165. Invalidation: daily close above $194 (the 21 EMA). (45% probability)
- Scenario 2: Neutral/Bullish Oversold Bounce and Range — price tags the lower band and EMA55, CMF holds above +0.05, and the stock bounces to the BB midline and the 21 EMA and then stalls. Trigger: hold above $180 with a reversal candle on volume. Target: $194-$198. Invalidation: close below $180. (30% probability)
- Scenario 3: Bearish Deep Pullback to the Measured Move — a sharper sell-off toward the rising SMA200 and VWAP area as the double top completes. Trigger: break below $175 on expanding volume. Target: $160-$165. Invalidation: reclaim of $186.90 (the SMA50). (25% probability)
PRICE TARGETS
- Target Price: $178.00 (20-day horizon, a ~3.3% decline from $184.11, reflecting a modest bearish tilt weighted by the 55-EMA support and the bounce risk)
- Expected Range: $162.00 to $196.00 (width $34, about 18.5% of current price, consistent with the 14-21 day guidance for volatile stocks; ATR of $8.28 supports a wide range)
- Key Levels: Support at $175.00 (the recent consolidation and the measured-move waypoint, just under the EMA55 at $183.64), Resistance at $194.16 (21 EMA, near the $196-$198 failed-bounce zone)
OVERALL BIAS
OVERALL BIAS: BEARISH - Price broke below the SMA50 and the 21 EMA with a −DI/+DI bearish crossover, a MACD bearish crossover with a falling histogram, RSI falling below 50, and heavier volume on the breakdown. Price is sitting at the lower Bollinger Band and the 55 EMA, so a bounce is possible. Still, the lower-high structure and the double-top neckline favor a drift lower toward $178.
This is educational analysis and not financial advice.