RKLB 20-day bearish forecast — Nov 1, 2026
- Bias: Bearish
- Timeframe: 20 days (made Nov 1, 2026, target date Nov 20, 2026)
- Price at analysis: $54.73
- Price target: $52.00
- Expected range: $45.50 – $60.00
- Result: Pending — graded after the close on Nov 20, 2026
Get a free AI analysis of RKLB today
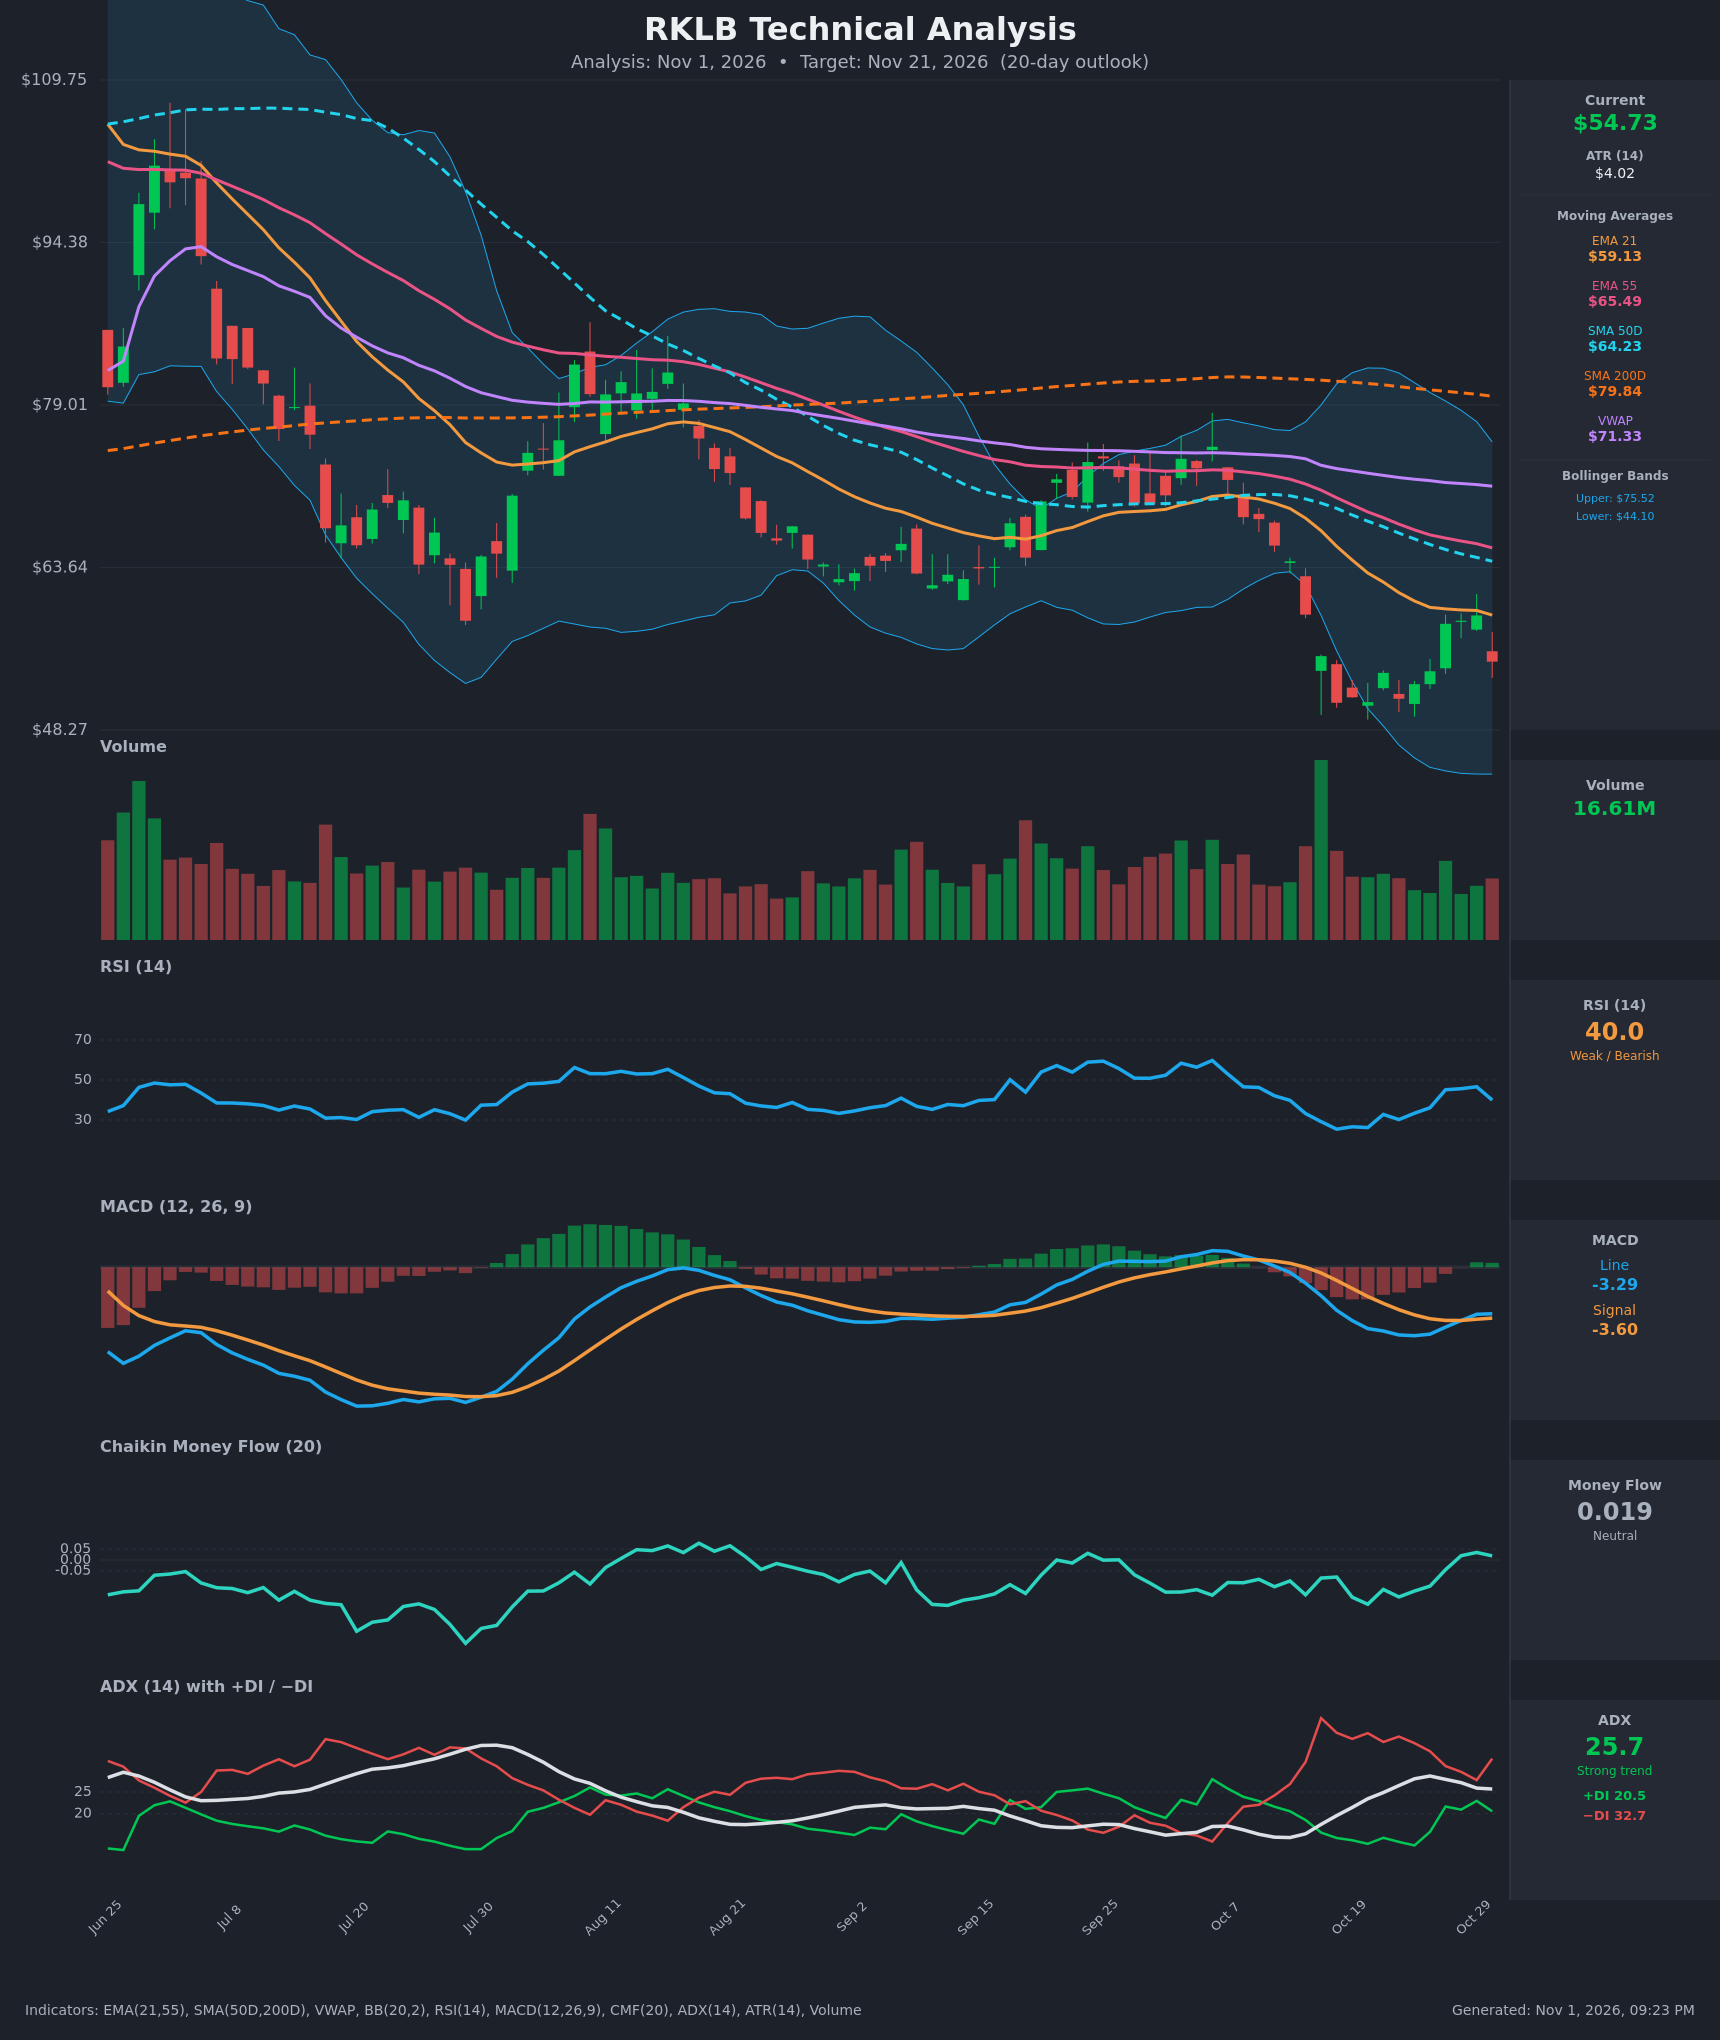
Analysis
TECHNICAL INDICATORS
- RSI (14): 39.96. It bounced from oversold (about 25) to a peak of 46.6 on Oct 29, then rolled over to 40 on the latest red candle. It is below 50 and failing under the midline, so momentum is weak but not oversold. [Bearish]
- 20 EMA: The chart shows EMA 21 at $59.13. Price at $54.73 is below it, and the EMA is still sloping down. EMA 21 ($59.13) is far below EMA 55 ($65.49), a confirmed bearish alignment. The EMA 21 zone is the first overhead resistance. [Bearish]
- MACD: Line -3.29, signal -3.60, so the histogram is marginally positive (+0.31). The line crossed above the signal on Oct 30 after a long negative stretch, but both lines are deep below zero. This is a weak bullish crossover inside a downtrend. The positive histogram is minimal, and the price drop on Oct 30 puts the crossover at risk. [Neutral]
- Bollinger Bands (20): Upper $75.52, lower $44.10, mid about $59.8. Bandwidth is very wide after the selloff. Price at $54.73 is below the midline and in the lower half of the bands, rejected near the midline/EMA 21 on Oct 29. The lower band at about $44 is the downside reference. [Bearish]
- CMF (20): 0.019, just inside the neutral zone after turning positive on Oct 28 from a sustained negative stretch (as low as -0.205). Buying pressure is improving but not yet at accumulation levels (>0.05). [Neutral]
- ADX (14): 25.7, down from a 28.7 peak but still above 25. −DI at 32.7 is well above +DI at 20.5, and −DI is turning back up while +DI is falling. This is a strong downtrend with bears in control. [Strong Trend – Bearish]
- Volume: 16.61M on the latest bar, about average. The Oct 16–17 capitulation spike was the largest volume bar of the period, while the rebound volume was lighter. The latest red candle shows modest selling. The bounce lacks strong volume confirmation. [Mildly Bearish]
DIVERGENCES & TRENDS
- Moving averages: Price ($54.73) is below EMA 21 ($59.13), EMA 55 ($65.49), SMA 50D ($64.23), VWAP ($71.33) and SMA 200D ($79.84). The SMA 50D has been below the SMA 200D for months (death cross already in place), so this is a firm long-term downtrend.
- Possible bullish divergence: RSI made a higher low (about 26–30 vs. the 25 low) while price retested the $50–51 area. Together with MACD turning up and CMF turning positive, this suggests selling is exhausting and a base is forming. It is still a minor divergence.
- Failed bounce: The Oct 27–29 relief rally stalled at EMA 21 (about $59) and was rejected, with RSI failing below 50. The Oct 30 drop to $54.73 (-7.4%) shows sellers defending the EMA.
- Indicator trends: −DI turning back up while ADX remains at 25+ suggests the trend is intact. The MACD crossover is fragile.
CHART PATTERNS
- Bearish Flag / Pennant (continuation): After the sharp drop from about $65 to $51, the consolidation and rally to $59 resembles a bearish flag or pennant. A rejection at the upper trendline (EMA 21 around $59) points to continuation lower. The measured move projects roughly toward $44–46, near the lower Bollinger Band.
- Possible Bullish Double Bottom (reversal): Lows around $50.84 (Oct 16) and $50.90 (Oct 20) form a double-bottom-like base. Confirmation would need a close above about $59–60, which has not happened. The pattern is invalid on a break below $50.
- The bigger picture is a large downtrend with lower highs from about $100, in a descending channel.
POTENTIAL SCENARIOS
- Scenario 1: Bearish Flag Breakdown — The rally failed at EMA 21 and the trend is firmly down (−DI 32.7, ADX 25.7). Price retests the $50–51 double-bottom zone and breaks it. Trigger: daily close below $50.80. Target: $46–47, toward the lower Bollinger Band near $44. Invalidation: daily close above $59.50. (50% probability)
- Scenario 2: Neutral Range Chop — Price consolidates between the $50 low and the $59 EMA 21 as selling exhausts and MACD and CMF stabilize. Trigger: holds $50–51 without a close above $59.5. Target: $52–57. Invalidation: close outside $50–$60. (28% probability)
- Scenario 3: Bullish Double Bottom Reversal — Higher RSI lows, positive CMF and a MACD cross support a base. Trigger: close above $59.5 on rising volume. Target: $64–65 (SMA 50D / EMA 55). Invalidation: close below $50. (22% probability)
PRICE TARGETS
For a 20-day timeframe, the range width should be about 8–12% of current price, scaled up toward the 14–21 day band. ATR of $4.02 supports a wide range, so I use roughly 22% as a volatility-adjusted width.
- Target Price: $52.00 (20 days, Nov 21, 2026)
- Expected Range: $45.50 to $60.00 (width $14.50 ≈ 26.5% of current price, justified by the high ATR of about 7% of price; the range is wide relative to the baseline 8–12% guidance because of elevated volatility)
- Key Levels: Support at $50.80, Resistance at $59.13
OVERALL BIAS
OVERALL BIAS: BEARISH - Price is below every major moving average, −DI dominates (32.7 vs. 20.5) with ADX above 25, and the recent bounce was rejected at EMA 21 near $59, which resembles a bearish flag. The MACD crossover and positive CMF only hint at a base and are not yet confirmed.
This is educational analysis and not financial advice.