ORCL 20-day bearish forecast — Nov 1, 2026
- Bias: Bearish
- Timeframe: 20 days (made Nov 1, 2026, target date Nov 20, 2026)
- Price at analysis: $130.67
- Price target: $127.50
- Expected range: $122.00 – $134.00
- Result: Pending — graded after the close on Nov 20, 2026
Get a free AI analysis of ORCL today
Analysis
TECHNICAL INDICATORS
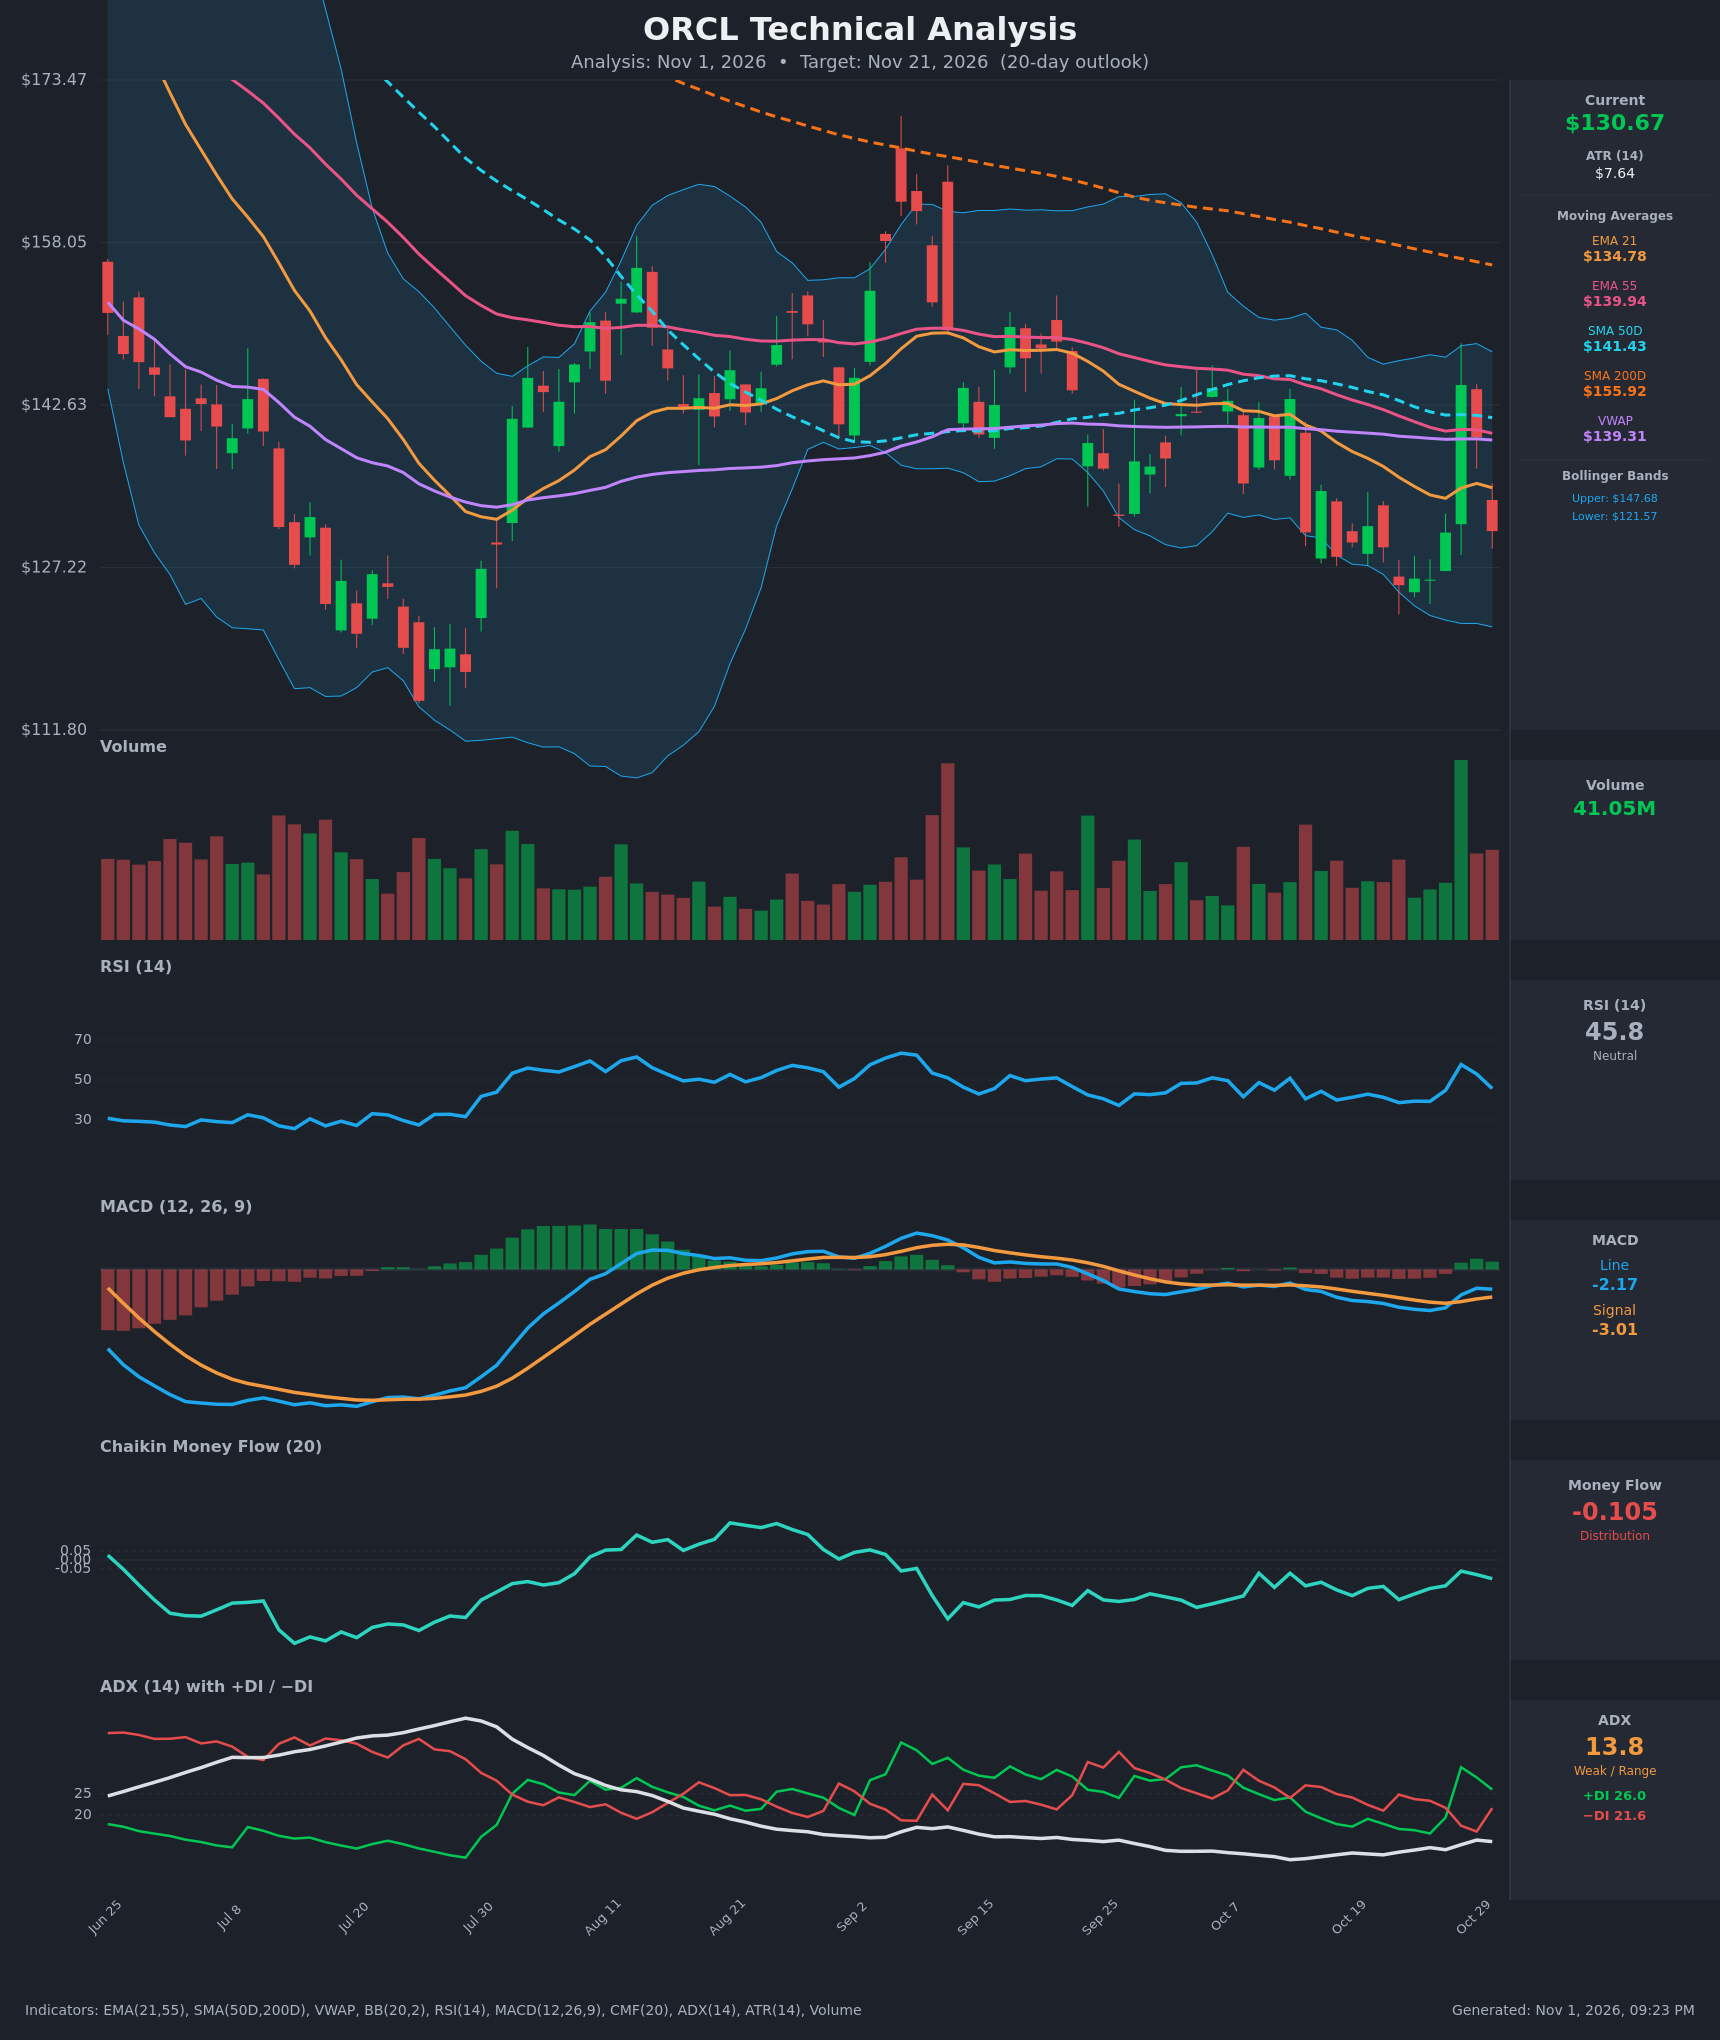
- RSI (14): 45.76, down sharply from 57.8 on Oct 28 after the spike candle failed. It sits below the 50 midline in the lower-neutral zone, with no oversold reading (<30) and no divergence. Momentum is fading. [Bearish]
- 20 EMA: The supplied value is the EMA 21 at $134.78, with price ($130.67) about 3% below it. The EMA 21 is sloping down and has acted as resistance since early October. The EMA 55 ($139.94) is also overhead. [Bearish]
- MACD: The line (-2.17) is above the signal (-3.01), a small bullish crossover on Oct 28 with a slightly positive histogram. Both lines remain well below zero, and the line has stalled (-2.79 → -2.06 → -2.17). It is a weak, countertrend bounce signal inside a bearish structure. [Neutral]
- Bollinger Bands (20): Upper $147.68, lower $121.57, midline about $134.6. Price is in the lower half, about $9 above the lower band. The Oct 28 spike hit the midline and above and was rejected, so the midline is acting as resistance. The bands are moderately wide, which fits ATR of $7.64. [Bearish]
- CMF (20): -0.105, below the -0.05 threshold and negative for the whole of October (range -0.06 to -0.22). That is persistent distribution, and even the +8% pop on Oct 28 did not lift CMF above -0.06. [Distribution]
- ADX (14): 13.8 with +DI 26.0 and -DI 21.6. ADX is below 20, so there is no established trend and the market is range-bound. +DI is on top only because of the Oct 28 spike. It has already fallen from 31.3 while -DI rebounded from 16.1, so the DI spread is narrowing and a bearish DI cross is likely. [Weak Trend, slight bearish tilt]
- Volume: 41.05M on the latest bar. The Oct 28 spike candle had the heaviest volume of the whole chart, yet it was fully reversed within two sessions. High-volume buying that fails to hold is a sign of supply. [Bearish]
Other moving-average and VWAP context:
- Price is below the SMA50D ($141.43), SMA200D ($155.92) and VWAP ($139.31). The SMA50 is below the SMA200 (death cross in force), and the EMA21 is below the EMA55, a bearish stack.
DIVERGENCES & TRENDS
- Divergence: No clear RSI divergence. Price lows at ~$125.5 (Oct 22-26) were matched by RSI around 39, roughly equal with no bullish divergence. MACD made lower lows into Oct 26 and only bounced on the spike.
- Trend: The structure is a persistent series of lower highs (Sep spike → $150s → $144.5) with the SMAs declining. The long-term trend is clearly down, with price about 16% under the SMA200D.
- Crossovers: The MACD bullish crossover on Oct 28 is the only constructive signal, and it is losing steam. The DI spread is converging towards a -DI cross. EMA21 is still falling and widening away from price.
- CMF: Sustained negative readings confirm that rallies are being sold into.
CHART PATTERNS
- Descending lower highs with a flat support base (~$125.5): Closest to a Descending Triangle or Bearish Pennant/Flag continuation. A decisive close below ~$125.5 would target roughly $118-$120 (pattern height measured down).
- Possible Bullish Double Bottom (~$125.5-$126 on Oct 22-26): This is the main counter-pattern. It needs a break above the neckline at the ~$131-$135 area (EMA21 and the Oct 28-29 highs), and the failed spike suggests it is not confirmed. A confirmed breakout would target roughly $140-$142, near the SMA50 and EMA55.
- With ADX at 13.8, pattern signals are low-reliability and the price is likely to chop between ~$125 and ~$135 before a decisive break.
POTENTIAL SCENARIOS
- Scenario 1: Bearish Rejection at EMA21 and Retest of Lows — Price remains capped by the declining EMA21/midline, distribution continues (CMF negative) and the Oct 28 spike proves a bull trap. Trigger: failure to close above $134.80 and a break below $128, then below $125.50. Target: $125.50 first, then $121.50-$122 (lower Bollinger Band), with a stretch target near $118. Invalidation: daily close above $135 with CMF turning positive. (50% probability)
- Scenario 2: Bullish Double-Bottom Bounce — Buyers defend $125.5, MACD holds its bullish crossover and price reclaims the EMA21 and VWAP. Trigger: close above $135 on above-average volume. Target: $139.9-$141.4 (EMA55/SMA50D). Invalidation: close below $125.50. (30% probability)
- Scenario 3: Neutral Range Chop — Price oscillates between $125.5 and $135 amid weak ADX and mixed momentum. Trigger: repeated failures at both $135 and $125.5. Target: $128-$133. Invalidation: close outside the $125-$135 range. (20% probability)
PRICE TARGETS
- Target Price: $127.50 (20-day, to ~Nov 21, 2026)
- Expected Range: $122.00 to $134.00 (width $12.00 ≈ 9.2% of current price, consistent with the 14-21 day guidance of ~8-12%)
- Key Levels: Support at $125.50, Resistance at $134.78
OVERALL BIAS
OVERALL BIAS: BEARISH - Price sits below every major moving average and VWAP, the SMA50/SMA200 death cross is in place, CMF shows persistent distribution, and the high-volume Oct 28 spike was fully reversed at the EMA21/Bollinger midline. The small MACD crossover and a possible double bottom at ~$125.5 keep conviction modest, and ADX is weak, so a choppy drift toward $127.50 is expected rather than a sharp collapse.
This is educational analysis and not financial advice.