SMH 20-day bearish forecast — Nov 1, 2026
- Bias: Bearish
- Timeframe: 20 days (made Nov 1, 2026, target date Nov 20, 2026)
- Price at analysis: $522.49
- Price target: $508.00
- Expected range: $482.00 – $536.00
- Result: Pending — graded after the close on Nov 20, 2026
Get a free AI analysis of SMH today
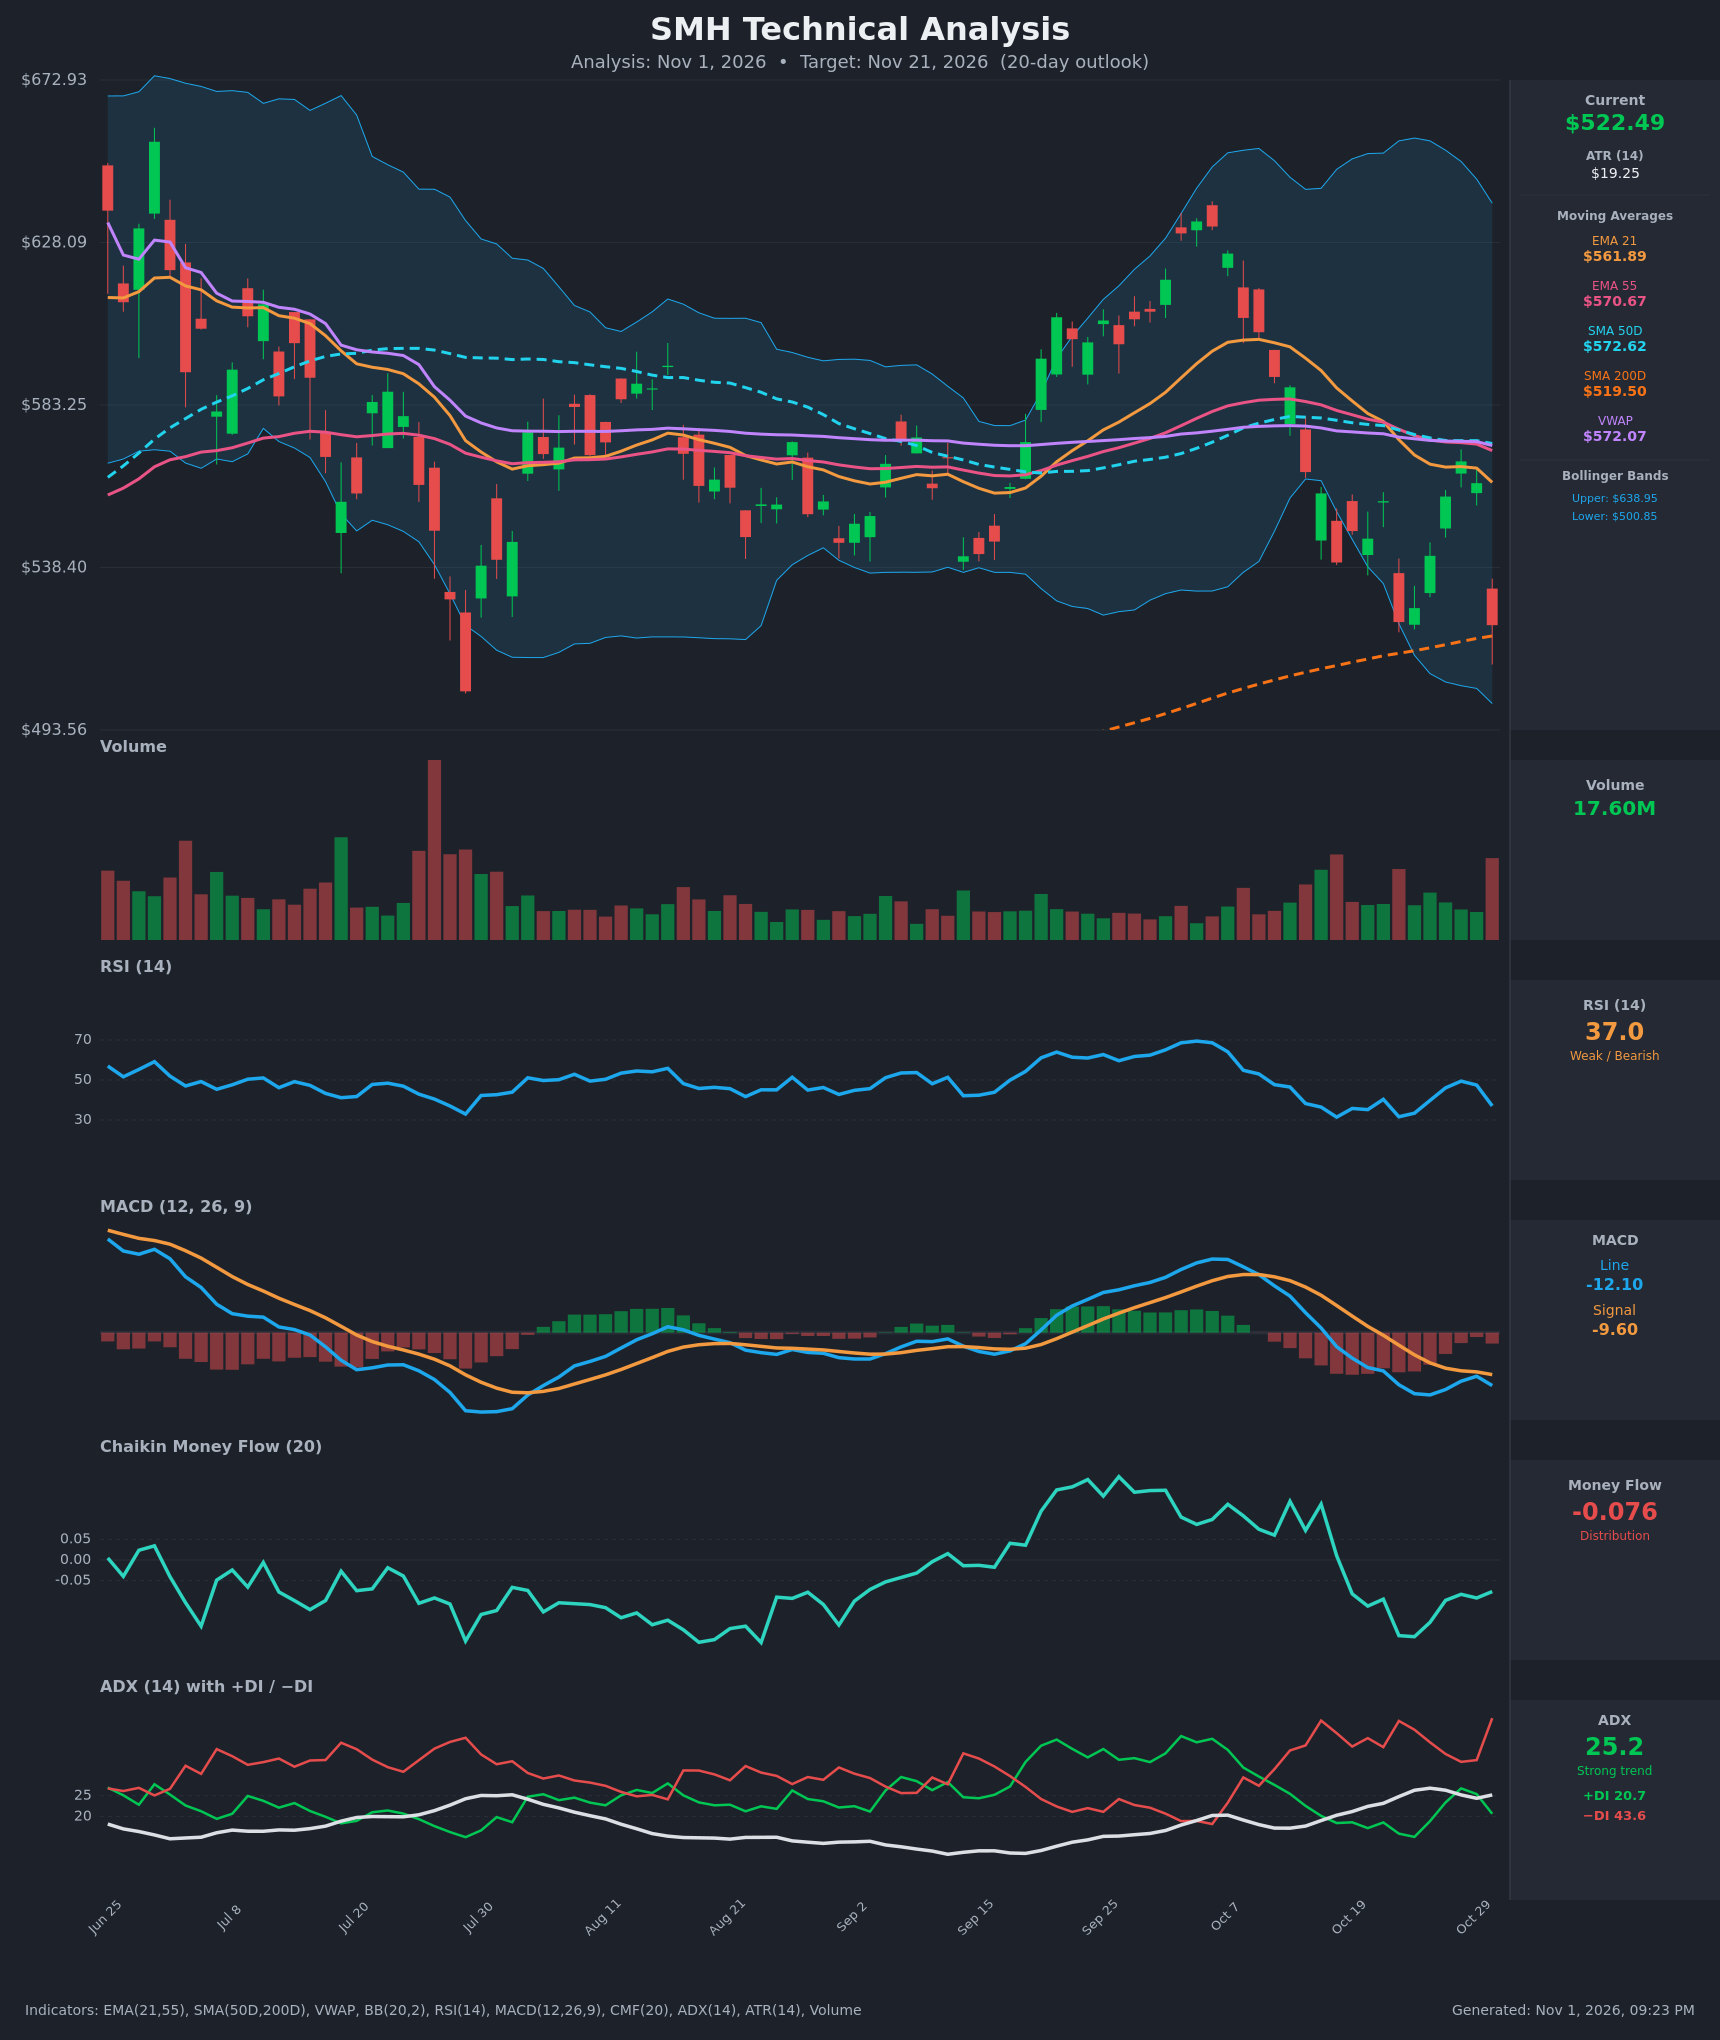
Analysis
TECHNICAL INDICATORS
- RSI (14): 37.04, down sharply from 49.4 on Oct 28. It has failed to hold above 50 and is rolling over again. It is near, but not yet in, oversold territory (<30), and the Oct 16 and Oct 22 lows at 31 produced only short bounces. [Bearish]
- 20 EMA (EMA 21): $561.89. Price at $522.49 is about 7% below it, and the EMA is falling. It is overhead resistance, and the EMA21 is now below the EMA55 ($570.67), a bearish crossover that occurred around Oct 22. [Bearish]
- MACD: Line -12.10 sits below Signal -9.60 with a negative, widening histogram. The line had started to curl up toward the signal (-9.97 vs -8.98) but turned down again on the latest bar. This is a bearish crossover that has been in place since about Oct 21, and the Oct 30 sell-off re-confirmed it. [Bearish]
- Bollinger Bands (20): Upper $638.95, lower $500.85, so the bands are wide. Price is in the lower quarter of the band, about $21.6 above the lower band. The latest candle is a large red bar, which suggests a possible test of the lower band. There is no squeeze. [Bearish]
- CMF (20): -0.076, below the -0.05 threshold. It collapsed from the +0.14 area in mid-October, has stayed negative since Oct 19, and the latest bar adds to the distribution. [Distribution]
- ADX (14): 25.2 with −DI 43.6 far above +DI 20.7. The trend is strong, and bears are firmly in control. ADX is turning back up as −DI spikes, which signals trend strength to the downside. [Strong Trend – Bearish]
- Volume: 17.60M on Oct 30, the biggest bar in the recent window, on a roughly -7% red candle. Heavy volume on a down day signals forced distribution or capitulation-style selling. [Bearish – confirms breakdown]
Other context:
- SMA 50D: $572.62, and price is below it.
- SMA 200D: $519.50, sitting just under price and the key long-term support.
- VWAP: $572.07, which is overhead.
- No death cross yet: SMA50 is still above SMA200 by about $53, though the gap is narrowing.
DIVERGENCES & TRENDS
- There is no bullish RSI divergence yet. RSI made higher lows in some windows (31.4 → 31.6), but price made a lower low ($539.79 → $523.35 → $522.49), so the data are mixed. The RSI lows near 31 are being tested repeatedly, which hints at a possible bounce but is not confirmed.
- Short-term momentum is bearish. Price fell from $567.67 on Oct 28 to $522.49 on Oct 30 (-8%). The bounce from $523 to $568 failed right at the EMA21/EMA55/SMA50 cluster (~$566-573).
- EMA21 crossed below EMA55 and is now below SMA50, and price is below the full MA stack. The trend structure is bearish.
- MACD and −DI are making new momentum lows. CMF has re-weakened after a failed recovery.
- Price is pressing the SMA200D ($519.50), the major long-term trend line. A close below it would be a significant technical break.
CHART PATTERNS
- Bearish Double Top (reversal): Peaks near $650 in June and about $635 in early October, with a lower second high. The neckline is roughly the $500-$510 July swing low. That level has not been broken yet, so the pattern is incomplete. A break would imply a measured move of about $130, far beyond 20 days.
- Failed range / lower-high structure: Price rallied from ~$540 to ~$635, then broke back below the whole $540-$575 consolidation area. The $566-$573 MA cluster is now resistance after the rejection on Oct 28.
- Bearish Pennant/Flag-like bounce: The Oct 22 to Oct 28 rally was a corrective bounce inside a downtrend and is now being sold. A continued decline toward the $500 lower band and July low is the most likely extension.
- Support zone: SMA200D at $519.50 and the lower BB at $500.85 are the key tests.
POTENTIAL SCENARIOS
- Scenario 1: Bearish Breakdown Below the 200-Day — Heavy-volume selling, a bearish MACD, and −DI dominance drive a close below SMA200D at $519.50 and a test of the lower band and July low. Trigger: daily close below $519.50 with volume above average. Target: $500-$508, with an extension to ~$485. Invalidation: daily close above $561.89 (EMA21). (50% probability)
- Scenario 2: Bullish Oversold Bounce Off the 200-Day — RSI near 30 and a test of SMA200D attract dip buyers, producing a relief rally into the MA cluster. Trigger: a hold of $519.50 with a bullish reversal candle and RSI above 40. Target: $545-$562 (the EMA21 area). Invalidation: close below $505. (32% probability)
- Scenario 3: Neutral Choppy Base — Price ranges between the lower band and the Oct 26-29 area. Trigger: ADX falls below 20 and RSI stays 35-48. Target: $510-$545. Invalidation: a close outside $500-$560. (18% probability)
PRICE TARGETS
- Target Price: $508.00 (20-day, Nov 21, 2026)
- Expected Range: $482.00 to $536.00 (width $54.00 ≈ 10.3% of the current price, consistent with the 14-21 day guidance)
- Key Levels: Support at $519.50 (SMA200D; below that, $500.85 lower BB), Resistance at $541.62 (recent swing close; above that, $561.89 EMA21)
OVERALL BIAS
OVERALL BIAS: BEARISH - Price is below every moving average with a bearish MACD, heavy-volume distribution, negative CMF, and a strong −DI-dominated ADX, and the last bounce failed at the $566-$573 MA cluster. The SMA200D at $519.50 and the oversold-leaning RSI make a bounce a real risk, so conviction is moderate.
This is educational analysis and not financial advice.