SOFI 20-day bullish forecast — Nov 1, 2026
- Bias: Bullish
- Timeframe: 20 days (made Nov 1, 2026, target date Nov 20, 2026)
- Price at analysis: $16.76
- Price target: $17.25
- Expected range: $16.20 – $17.90
- Result: Pending — graded after the close on Nov 20, 2026
Get a free AI analysis of SOFI today
Analysis
TECHNICAL INDICATORS
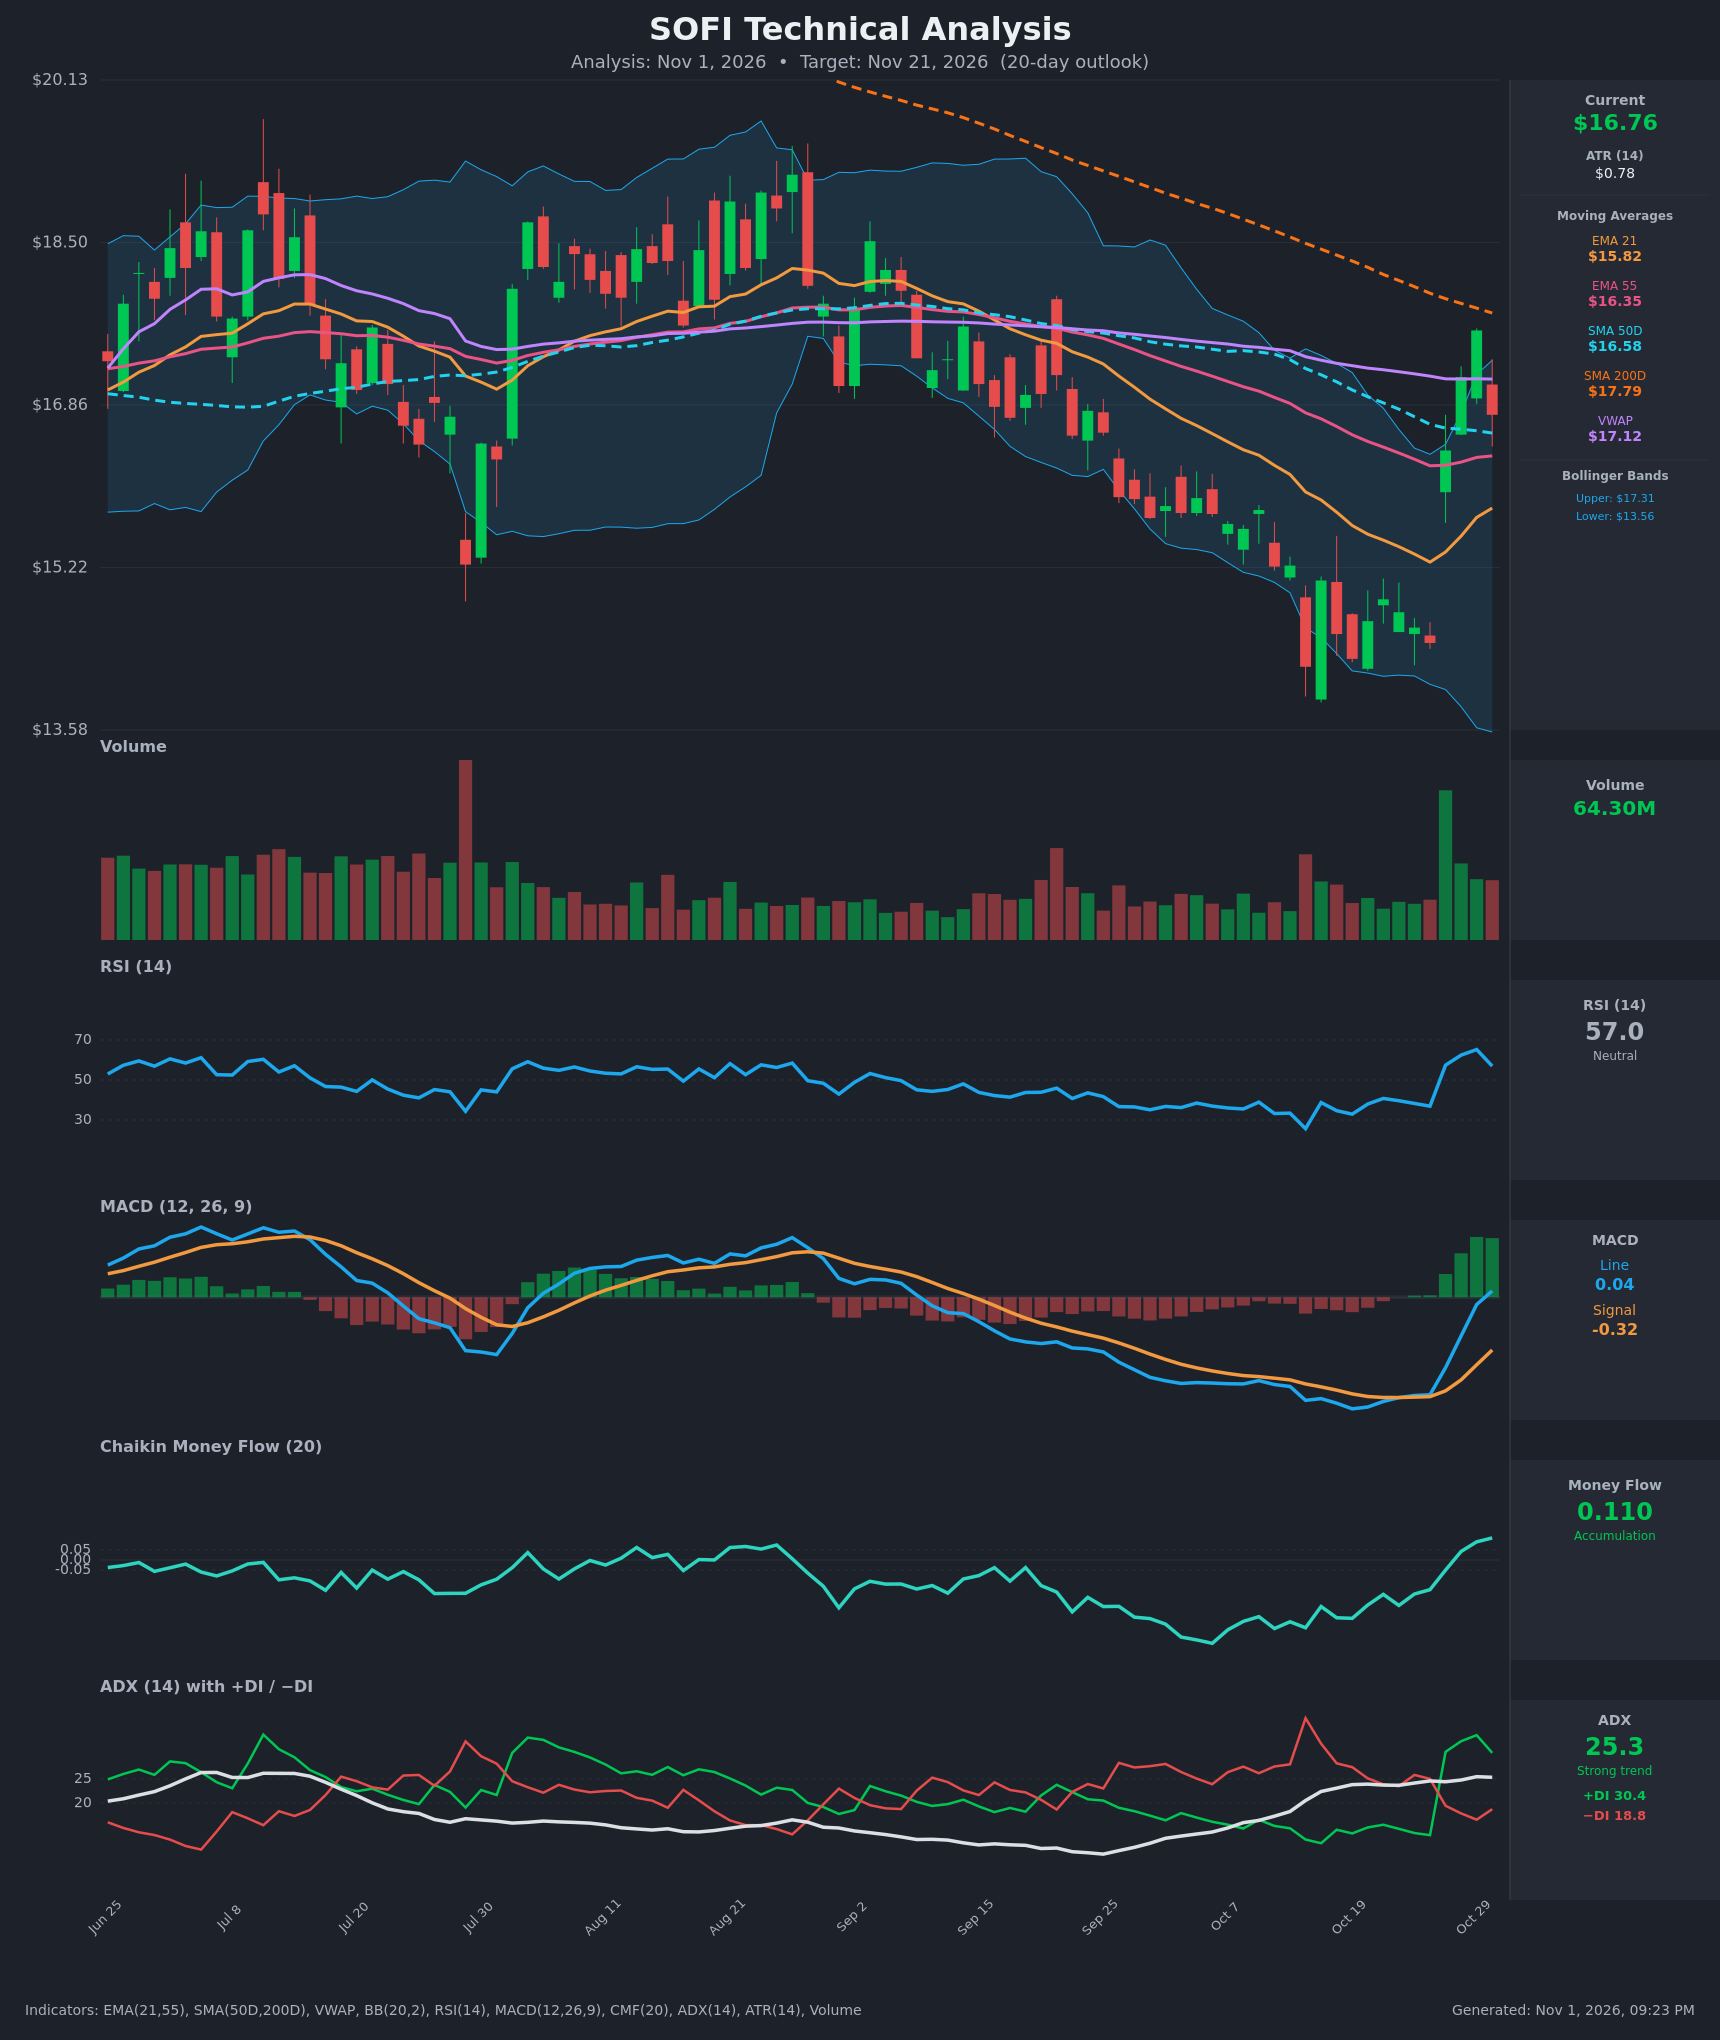
- RSI (14): 56.97, down from a 65.2 peak on Oct 29 after surging from 25.7 on Oct 14. It is back above 50 and well clear of oversold. The latest dip shows some cooling, but momentum has shifted from bearish to constructive. [Bullish]
- 20 EMA (EMA 21 = $15.82): Price at $16.76 is about 6% above the EMA 21, which is rising and now acts as dynamic support. Price is also above EMA 55 ($16.35) and SMA 50 ($16.58), but the EMA 21 is still below EMA 55, so there is no bullish EMA crossover yet. [Bullish]
- MACD: Line 0.038 crossed above Signal -0.322 on Oct 30, and the line has turned positive. The histogram is strongly positive and expanding, a fresh bullish crossover from deeply negative territory. [Bullish]
- Bollinger Bands (20): Upper $17.31, lower $13.56, midline about $15.44. Price is in the upper half (%B ≈ 0.85) after the rebound from the lower band. The bands are still wide from the prior sell-off, so the Oct 29 high ($17.61) pushed above the upper band and was rejected. [Neutral]
- CMF (20): 0.110, rising steadily from -0.34 on Oct 12 and above the +0.05 threshold. It has been positive for three straight sessions, which points to real accumulation behind the bounce. [Accumulation]
- ADX (14): 25.3, at the strong-trend threshold and rising from 17.3. +DI (30.4) is well above −DI (18.8) after a decisive bullish DI crossover on Oct 27. The trend is turning up with strength, though ADX is only just crossing 25. [Strong Trend + Bullish]
- Volume: 64.30M on the latest session, which is elevated. The breakout bar on Oct 27 had the highest volume in months, so buyers showed real participation. The latest bar is red and the high-volume rejection from $17.61 is a caution. [Bullish breakout volume, mild distribution on the pullback]
DIVERGENCES & TRENDS
- No classic divergence is present. RSI, MACD and CMF all made higher highs along with price, and the Oct 14 low ($14.22) was followed by a higher momentum base.
- MACD histogram expanded and flipped positive, and CMF moved from deeply negative to accumulation. The shift is broad-based.
- Price recaptured EMA 21, EMA 55 and SMA 50 within a few sessions. This is a significant reclaim.
- The bearish structure is still partly intact. Price is below SMA 200 ($17.79, falling), which sits below SMA 50 (a death cross already in place), and below VWAP ($17.12). The descending orange trendline from the August highs sits near $17.7–17.8 and lines up with the SMA 200.
- The Oct 30 candle is a red pullback of about 4.8% from $17.61, which is a normal retest after a 20%+ burst.
- ADX +DI is starting to roll over slightly (34.0 to 30.4), a sign of short-term cooling.
CHART PATTERNS
- Closest reference pattern: Bullish Falling Wedge / downtrend reversal. The August–October decline was a descending channel, and the Oct 27 gap-up broke out of it and reclaimed the 21/55 EMAs. The measured move of the wedge points back toward the $17.8–18.5 zone, where the SMA 200 and the prior breakdown area sit.
- Secondary read: a bullish flag-style pullback. The current dip from $17.61 to $16.76 resembles a shallow consolidation after an impulsive leg. Holding above $16.35–16.58 keeps this valid.
- Caveat: The orange trendline and the SMA 200 are heavy overhead resistance. A failed retest could turn this into a bear-market rally rather than a full reversal.
POTENTIAL SCENARIOS
- Scenario 1: Bullish Consolidate-and-Grind Higher — Price holds above the EMA 55/SMA 50 shelf ($16.35–16.58) and resumes the move up, with MACD and CMF supporting. Trigger: Daily close above $17.12 (VWAP), then above $17.61. Target: $17.80–$18.00 (SMA 200 and the descending trendline). Invalidation: Daily close below $16.35. (50% probability)
- Scenario 2: Bearish Failed Rally — The rally stalls at the SMA 200/VWAP/trendline confluence, and price falls back through the moving averages. Trigger: Close below $16.35 on rising volume, with MACD flattening. Target: $15.80 (EMA 21), then $15.40 (Bollinger midline). Invalidation: Close above $17.80. (30% probability)
- Scenario 3: Neutral Range Digestion — Price chops between $16.30 and $17.60 as the market digests the 20% spike. Trigger: ADX falling back below 25 with price pinned near VWAP. Target: $16.80–$17.10. Invalidation: Close outside $16.30–$17.80. (20% probability)
PRICE TARGETS
- Target Price: $17.25 (20-day, +2.9% from current)
- Expected Range: $16.20 to $17.90 (width $1.70 ≈ 10.1% of current price, consistent with the 14–21 day guidance)
- Key Levels: Support at $16.35 (EMA 55, with SMA 50 at $16.58 just above), Resistance at $17.79 (SMA 200, which lines up with the descending trendline near $17.7–17.8)
OVERALL BIAS
OVERALL BIAS: BULLISH - A bullish MACD crossover, CMF accumulation, and a +DI-led ADX at 25 all confirm a trend change. Price has reclaimed the EMA 21, EMA 55 and SMA 50, so a drift toward the $17.25 area is more likely than not. The SMA 200, VWAP and the descending trendline are heavy overhead resistance, so conviction is moderate.
This is educational analysis and not financial advice.