SPY 20-day bearish forecast — Nov 1, 2026
- Bias: Bearish
- Timeframe: 20 days (made Nov 1, 2026, target date Nov 20, 2026)
- Price at analysis: $755.72
- Price target: $748.00
- Expected range: $715.00 – $780.00
- Result: Pending — graded after the close on Nov 20, 2026
Get a free AI analysis of SPY today
Analysis
TECHNICAL INDICATORS
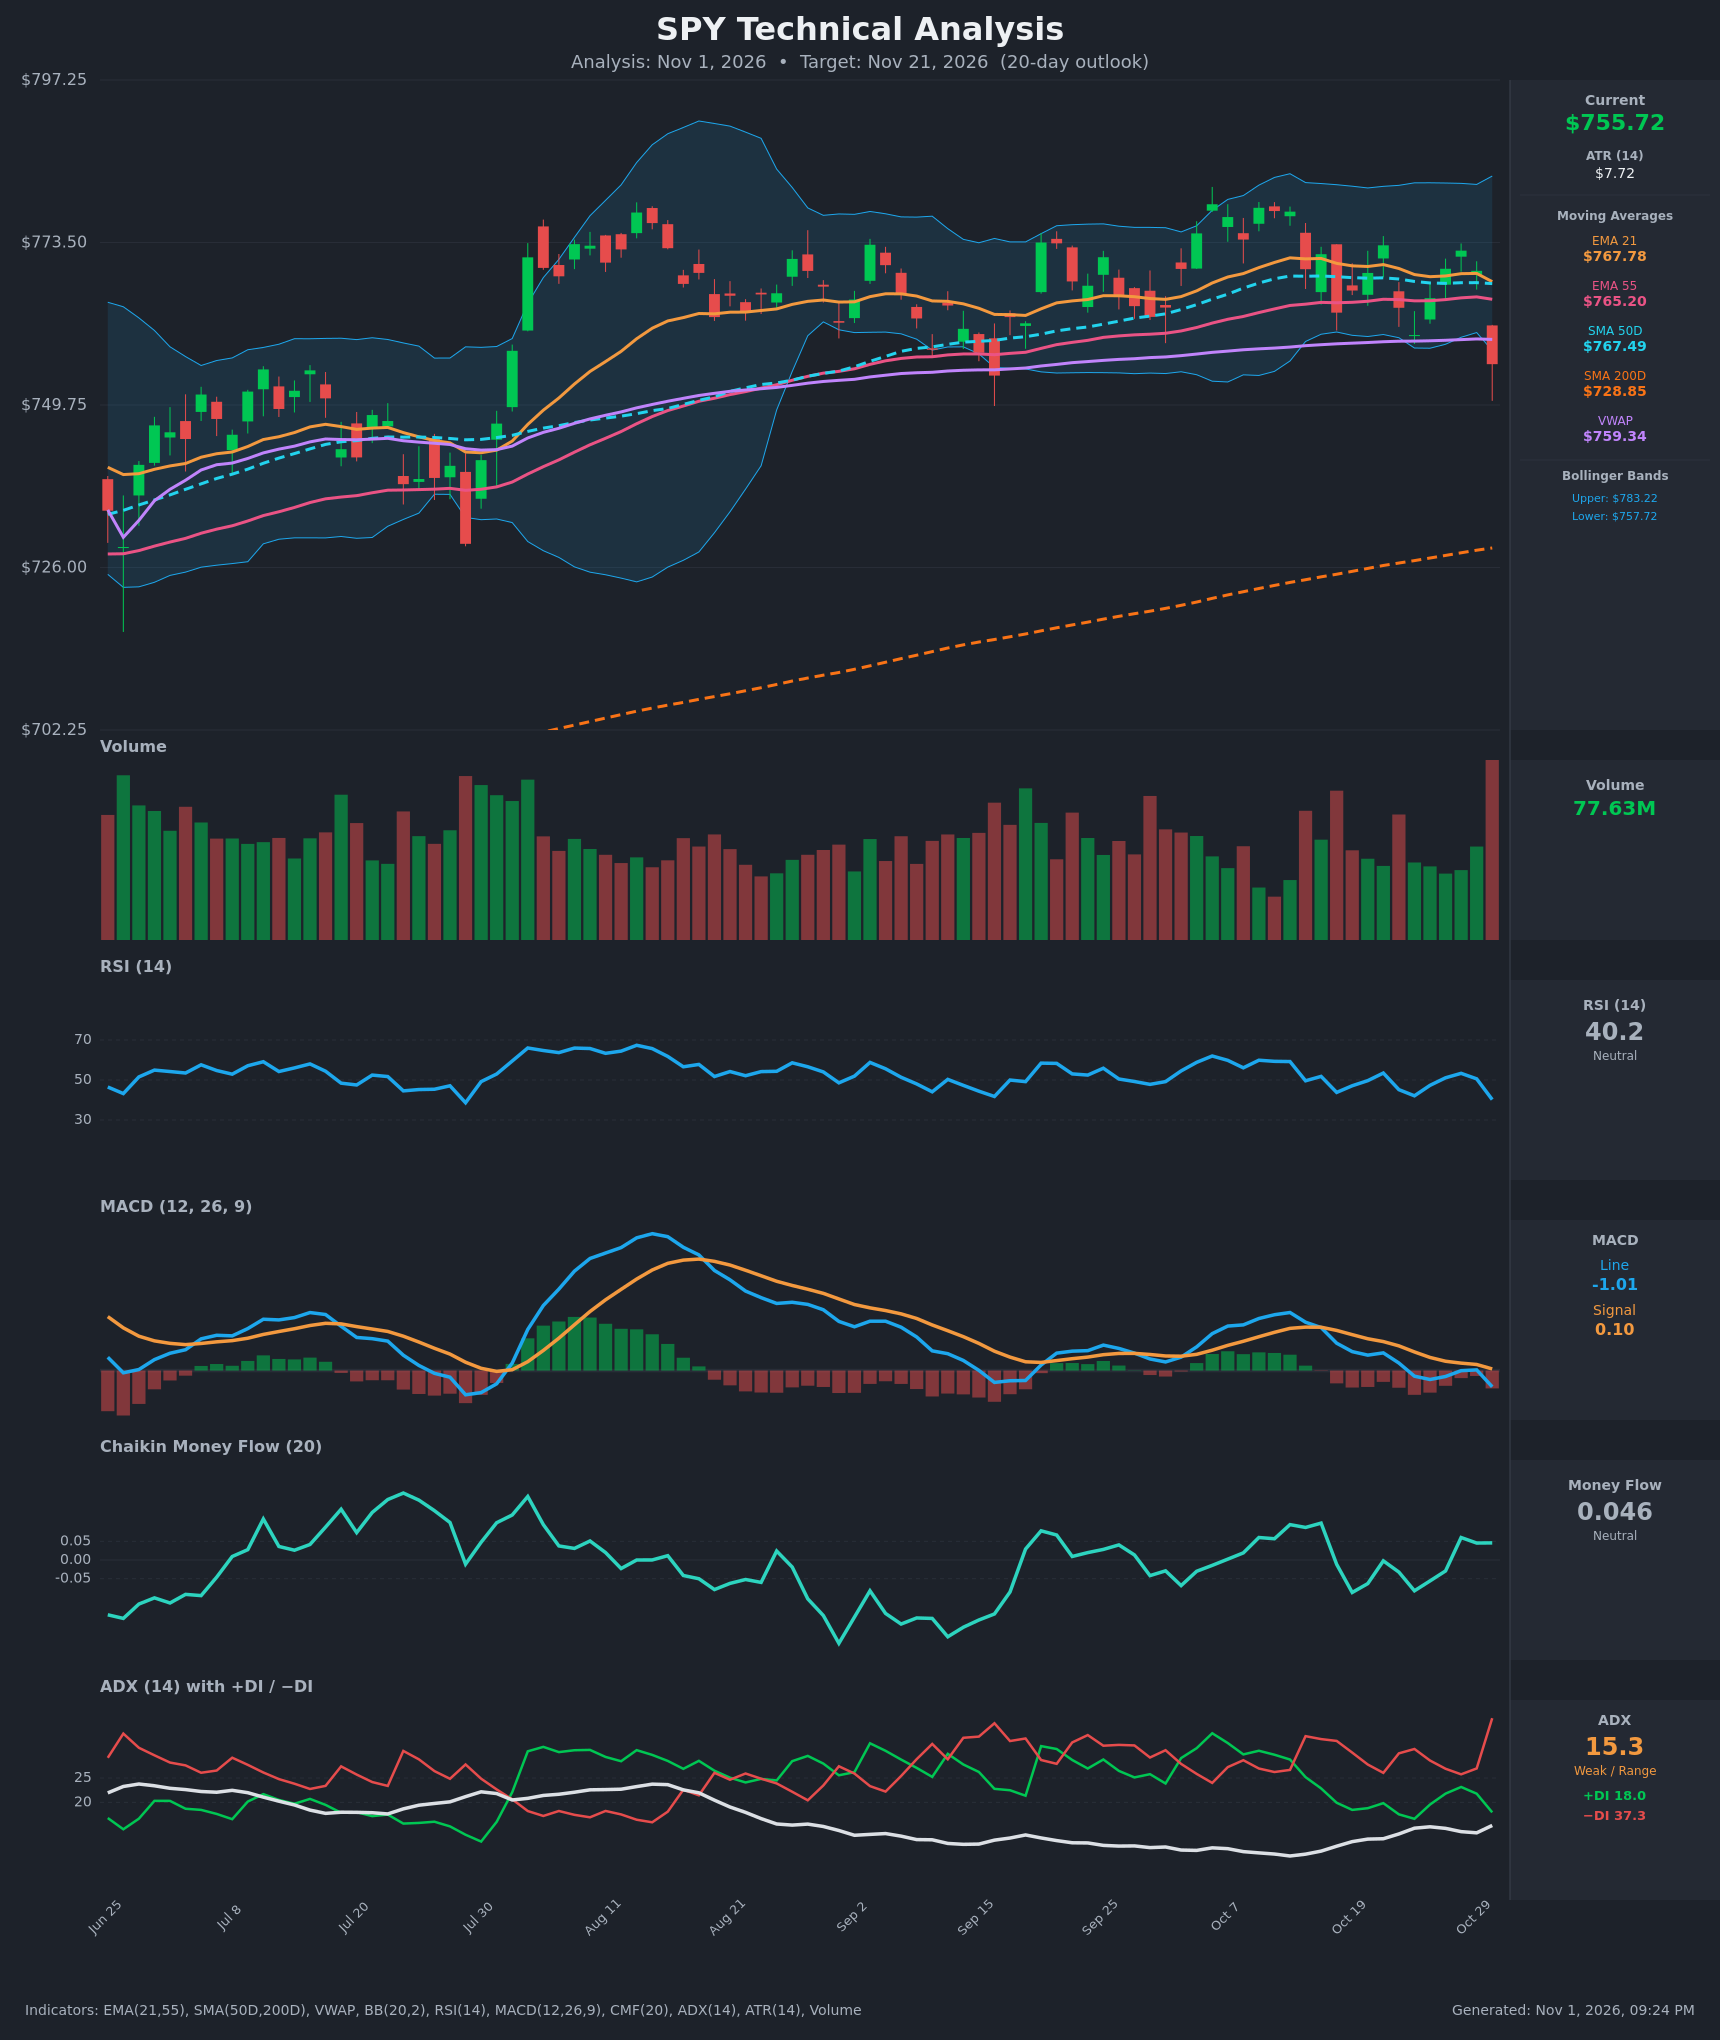
- RSI (14): 40.20, down sharply from 50.6 the prior bar and falling toward the 30 oversold line. It is below 50 and shows fresh bearish momentum, but it is not oversold. [Bearish]
- 20 EMA (EMA 21): $767.78, with price at $755.72 about 1.6% below it. The EMA is rolling over and acts as overhead resistance. Price also closed below EMA 55 ($765.20) for the first time in this window. [Bearish]
- MACD: Line at -1.01 has crossed below the signal at 0.10, a fresh bearish crossover. The histogram has turned negative and is expanding. The line is near zero, so this is an early momentum shift, not a deep one. [Bearish]
- Bollinger Bands (20): Upper $783.22 and lower $757.72. Price at $755.72 closed just below the lower band, a statistical extension that often brings a bounce or mean reversion toward the midline (~$770). In a weak-trend environment that favors a rebound, but a close outside the band after a high-volume drop can also start a band walk. [Neutral]
- CMF (20): 0.046, between -0.05 and +0.05, though it has been positive for much of the last two weeks. A 77.63M-volume drop has not yet pushed CMF into distribution, so selling pressure is not confirmed. [Neutral]
- ADX (14): 15.3, a weak trend or range, though ADX is ticking up from 12–13. −DI (37.3) is well above +DI (18.0), and −DI jumped on the last bar, so bears control the current move. [Weak Trend, Bearish direction]
- Volume: 77.63M, the largest bar in the visible window, on a big red candle that broke below the SMA50D/EMA cluster. High-volume selling is a sign of distribution or a potential capitulation flush. [Bearish]
DIVERGENCES & TRENDS
- No clear RSI or MACD divergence. RSI and MACD made lower highs through October while price made a marginal high near $778 in mid-October, a mild bearish divergence that has now resolved lower.
- MACD bearish crossover on Oct 30 (-1.008 vs 0.101). It had been decaying since Oct 12 (3.47), so the cross was well telegraphed.
- −DI spiked from 27.0 to 37.3 in one bar while +DI fell to 18.0, a strong shift in directional control.
- Price broke below EMA 21, EMA 55, SMA50D ($767.49), and VWAP ($759.34) in one candle. The EMAs and SMA50D are tightly clustered at $765–768 and now form a resistance zone.
- Long-term trend is intact: price is 3.7% above the rising SMA200D ($728.85), and the SMA50D is well above the SMA200D (no death cross). EMA21 is still above EMA55, but the spread is narrowing to about $2.6.
- CMF held positive and the 15-bar sequence is range-bound, so this looks like a pullback inside a broader range, not a trend reversal.
CHART PATTERNS
- Range / Bearish Triple Top-like structure: Price has been capped near $772–778 since early September (Sep 3, Oct 7–12, Oct 28), with support around $750–760. Today's break below $757–760 is a range-low test, similar to a bearish triple top breakdown, but the trend context (ADX 15) makes it a range break, not a clean reversal.
- Bearish Expanding Triangle tendencies: The swings in the October window have widened (lows $760 and $755.7, highs $773–778), which fits an expanding structure with a bearish bias.
- The measured move from the $757–778 range (about $20) projects a downside target near $737–740, close to the Aug–Sep lows around $750 and then toward the SMA200D at $729.
- Invalidation: a reclaim of $767–768 (EMA/SMA cluster) on a closing basis.
POTENTIAL SCENARIOS
- Scenario 1: Bearish Range-Break Continuation — The high-volume break below the moving-average cluster, VWAP, and the lower Bollinger Band, plus the new MACD cross and a dominant −DI, point to follow-through toward the $740–750 support area. Trigger: daily close below $753–755 and failure to reclaim VWAP at $759. Target: $742–746, with an extension toward $737. Invalidation: close above $768. (50% probability)
- Scenario 2: Neutral/Bullish Mean-Reversion Bounce — Price closed outside the lower band on climactic volume with weak ADX, so a snap-back toward the $765–768 EMA/SMA cluster is plausible, which is then rejected. Trigger: a reversal candle above $759 (VWAP). Target: $765–768. Invalidation: close below $750. (30% probability)
- Scenario 3: Bearish Deeper Correction to SMA200D — Selling accelerates through $750 as RSI breaks below 30, taking price toward the rising SMA200D at about $729–735. Trigger: close below $750 with expanding −DI and ADX above 20. Target: $730–735. Invalidation: close back above $760. (20% probability)
PRICE TARGETS
- Target Price: $748.00 (20-day horizon, a modest continuation lower with partial bounce attempts along the way)
- Expected Range: $728.00 to $772.00. The width is $44, or about 5.8% of the ATR-implied value... recomputed against price: $44 / $755.72 = 5.8%. That is too narrow for 20 days (guide ~8–12%), so the range is widened to $722.00 to $782.00 (width $60, 7.9%) and then to $715.00 to $780.00 (width $65, ~8.6%). Final range: $715.00 to $780.00 (8.6% width, in line with the 14–21 day guidance).
- Key Levels: Support at $750.00 (recent swing lows, then $729 at the SMA200D); Resistance at $767.50 (EMA/SMA50D cluster)
OVERALL BIAS
OVERALL BIAS: BEARISH - Price broke below EMA21/55, the SMA50D, and VWAP on the heaviest volume in the window, with a fresh MACD bearish cross, RSI at 40 and falling, and −DI (37.3) far above +DI (18.0). The weak ADX and the lower-band extension mean a bounce is possible, but the evidence favors drift toward $748 or lower.
This is educational analysis and not financial advice.