XLF 20-day bullish forecast — Nov 1, 2026
- Bias: Bullish
- Timeframe: 20 days (made Nov 1, 2026, target date Nov 20, 2026)
- Price at analysis: $56.51
- Price target: $57.30
- Expected range: $54.00 – $58.80
- Result: Pending — graded after the close on Nov 20, 2026
Get a free AI analysis of XLF today
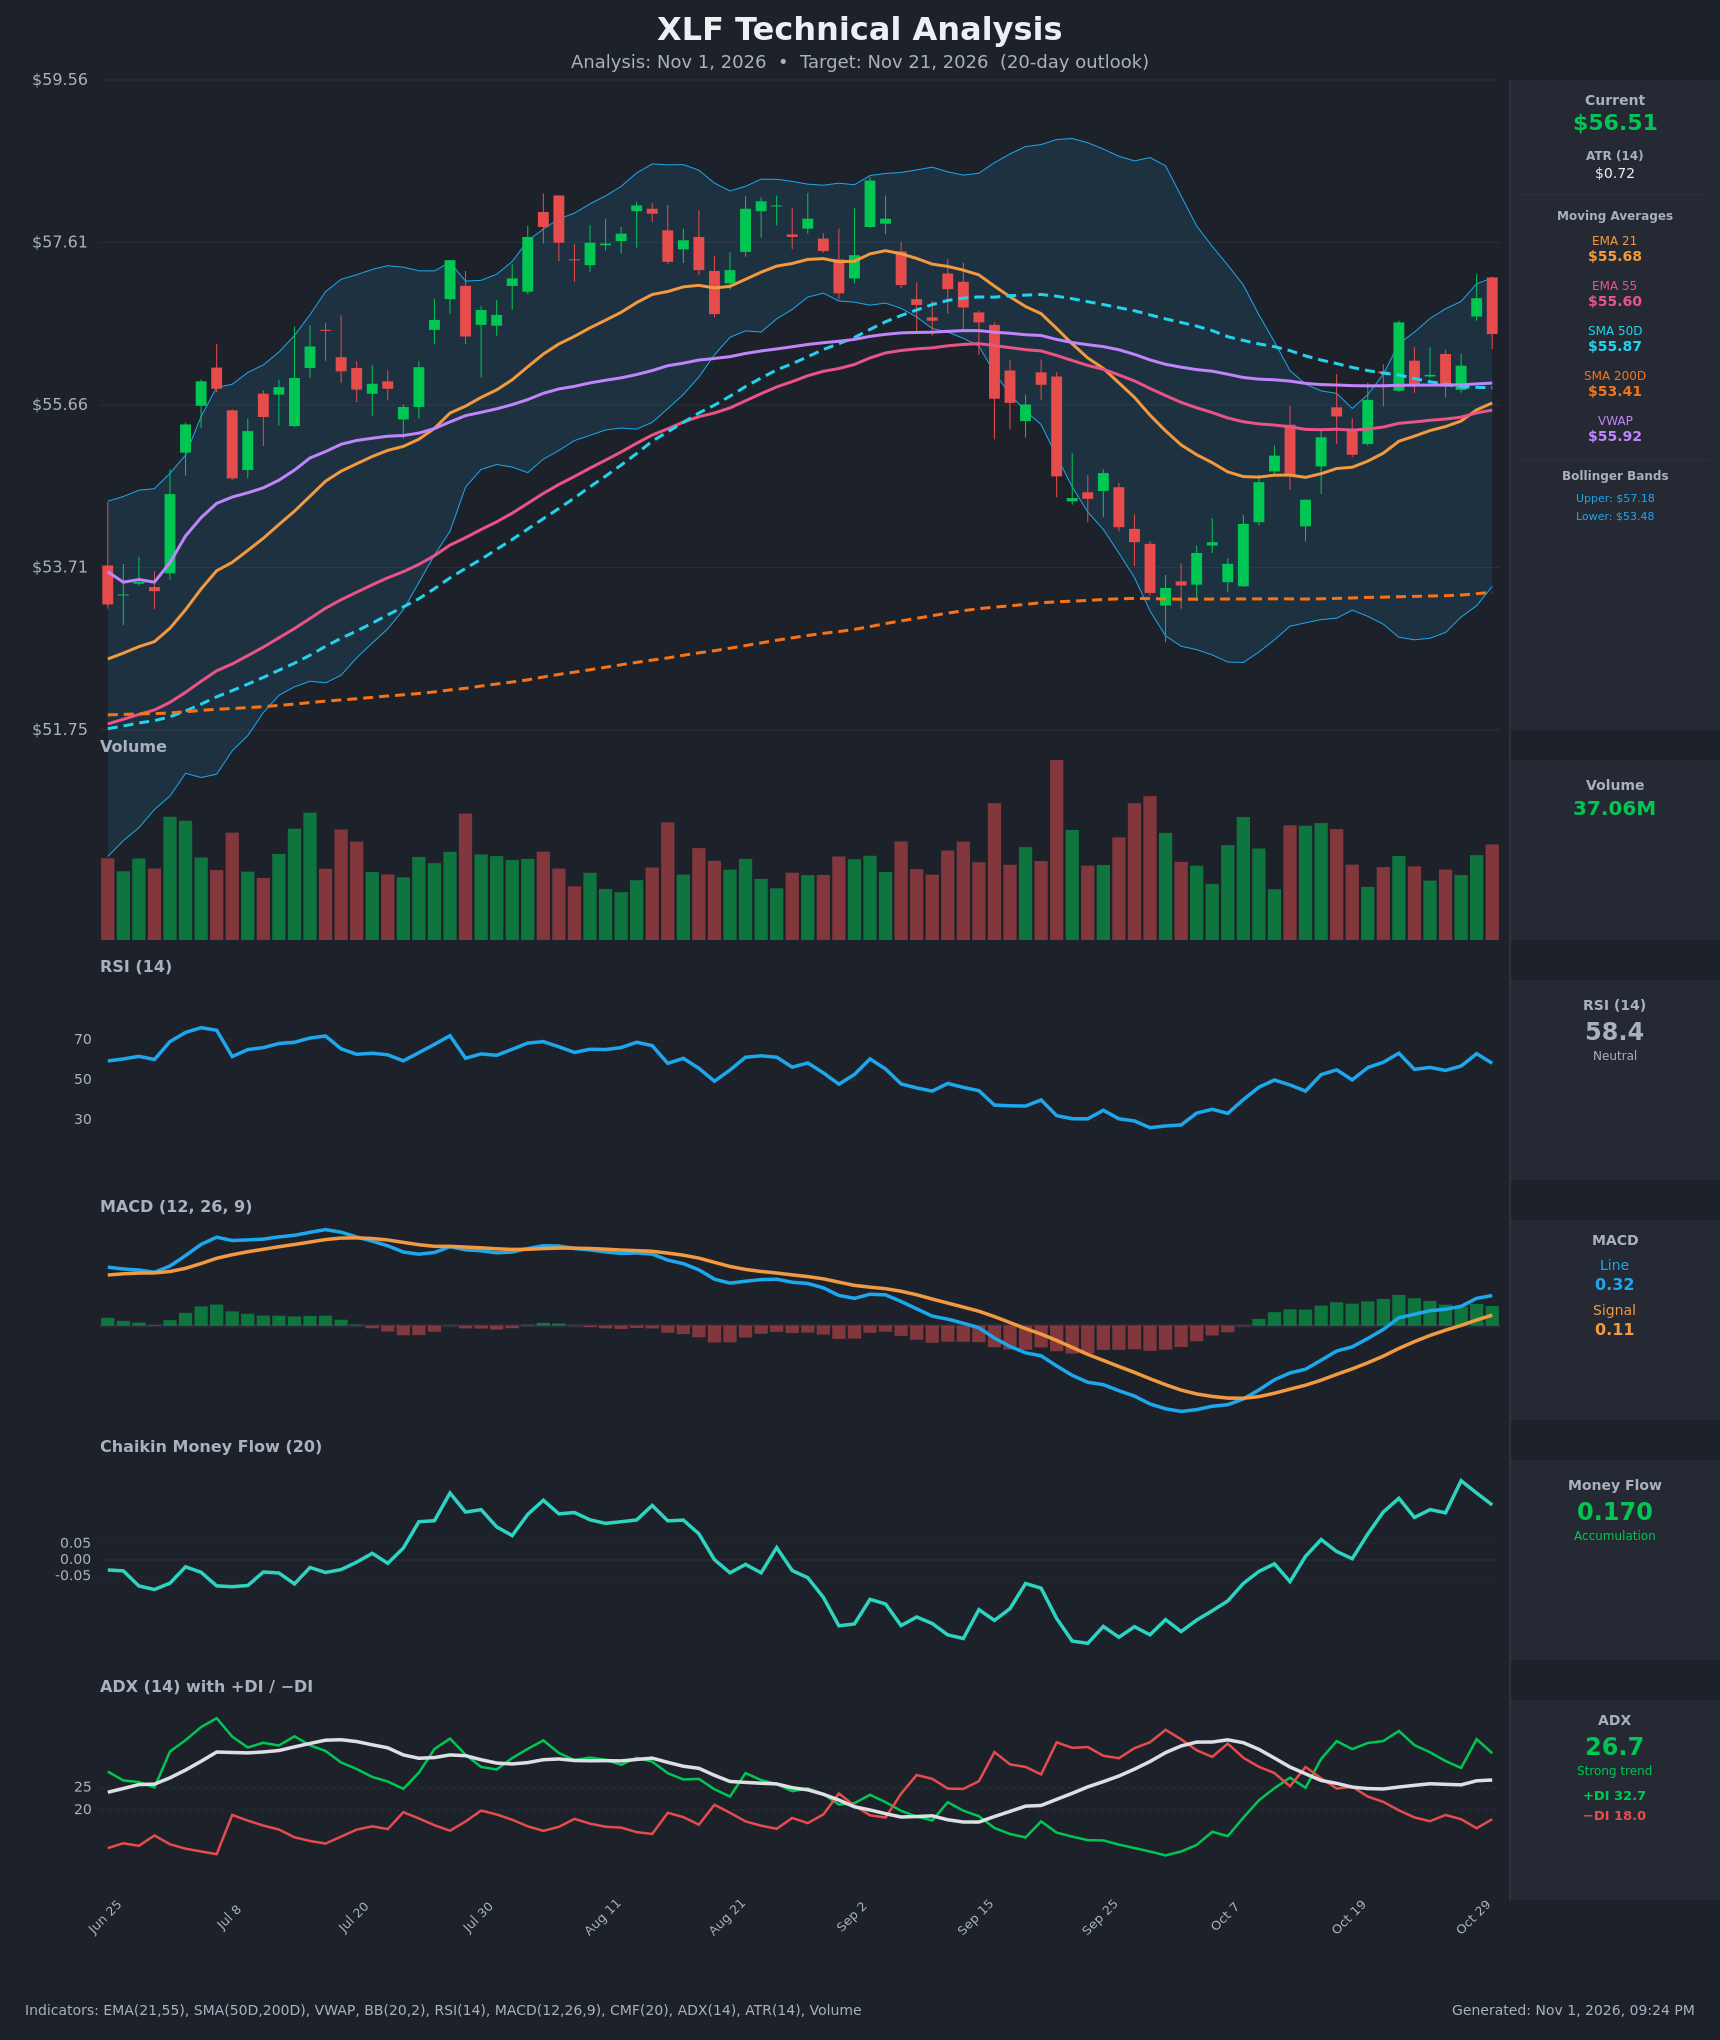
Analysis
TECHNICAL INDICATORS
- RSI (14): 58.36, above the 50 midline and well below overbought. It has recovered from the ~27 low in late September and is oscillating in the 55-63 range, so momentum is constructive but not stretched. [Bullish]
- 20 EMA: The 21 EMA is $55.68 and price at $56.51 is about 1.5% above it. The EMA is rising, with EMA21 above EMA55 ($55.60) after a recent bullish cross. The cluster of EMA21, EMA55, SMA50 ($55.87) and VWAP ($55.92) around $55.6-55.9 is the support zone. [Bullish]
- MACD: The line (0.324) is above the signal (0.114) and both are above zero. The bullish crossover happened around Oct 28, and the histogram is positive and has widened over the last two weeks. [Bullish]
- Bollinger Bands (20): Upper $57.18, lower $53.48, midline about $55.33. Price is in the upper half, about 0.73 of the band width, with room to the upper band (~$0.67). The bands have started to expand off a squeeze. [Bullish]
- CMF (20): 0.170, well above +0.05. It has been positive and mostly rising since early October, which indicates sustained accumulation. It peaked near 0.245 and is easing slightly. [Accumulation]
- ADX (14): 26.7 with +DI 32.7 above −DI 18.0. ADX is above 25 and edging up, and the DI spread is wide, so this is a strong uptrend in progress. [Strong Trend + Bullish]
- Volume: 37.06M, about average. Recent up days (Oct 22, Oct 29) saw moderate volume. The Oct 30 pullback was a small red candle on normal volume, with no sign of heavy distribution. [Neutral to mildly supportive]
DIVERGENCES & TRENDS
- There is no meaningful bearish divergence. RSI (58) is below its Oct 22/29 peaks (~63) while price is slightly lower than the Oct 29 high ($56.94), which is just normal consolidation.
- The MACD bullish crossover came after a deep trough in early October, and its slope is rising.
- Price has reclaimed all key moving averages (EMA21, EMA55, SMA50, VWAP) and is above the rising SMA200 ($53.41), so the long-term trend is up. The SMA50 ($55.87) is flat to slightly falling and is being tested; a decisive close above it would confirm the trend change.
- The SMA50 is above the SMA200 (no death cross) and the 50/200 gap is narrowing, so there is no golden-cross event.
- The +DI/−DI crossover happened around Oct 15 and the gap has widened since.
- The main overhead hurdle is the Aug-Sep high zone of $57.6-58.0. The prior range top is at about $57.0-57.6.
CHART PATTERNS
- The V-shaped recovery from the ~$53.2 late-September low, followed by a higher-low sequence in October, resembles a Bullish Double Bottom-style reversal. The lows at ~$53.2 and ~$53.5 define the base and the neckline is around $56.0-56.5, which price has now cleared. The measured move from the base (~$3.3 height) projects roughly $59, though that is probably too ambitious for 20 days and matches the chart top near $58-59.
- Price is also consolidating in a tight band ($55.9-56.9) just above the converged moving averages, a Bullish Flag/Pennant-type pause after the sharp advance. A breakout above $57.0 targets about $57.6-58.0.
- The two-month downtrend from the Aug high is being retraced, with overhead supply near $57.6.
POTENTIAL SCENARIOS
- Scenario 1: Bullish Breakout Continuation — Price holds above the $55.7-55.9 MA cluster, consolidates briefly, then pushes through the upper Bollinger band area toward the prior range highs. Trigger: close above $57.00-57.20 (the $56.94 recent high and upper band). Target: $57.60-58.20. Invalidation: daily close below $55.60. (55% probability)
- Scenario 2: Neutral Range Consolidation — Price chops between $55.60 and $57.20 as it digests the rally and meets resistance at the SMA50 and the band top. Trigger: failure to close above $57.2 with RSI flattening near 50-60. Target: $56.0-56.8. Invalidation: close outside the $55.4-57.4 range. (25% probability)
- Scenario 3: Bearish Failed Rally — The rally fails at resistance and price loses the moving average cluster, with MACD histogram rolling over. Trigger: close below $55.60 with rising selling volume. Target: $54.50, then the $53.4 SMA200/lower band zone. Invalidation: reclaim of $56.50 on strong volume. (20% probability)
PRICE TARGETS
For 20 days (Nov 21, 2026), the range width should be about 8-12% of price (~$4.5-6.8). The range below is $54.00 to $58.80, a $4.80 width, or 8.5%.
- Target Price: $57.30 (20-day target)
- Expected Range: $54.00 to $58.80
- Key Levels: Support at $55.68 (EMA21, with $55.60 EMA55 just below), Resistance at $57.18 (upper Bollinger Band, with $57.60 behind it)
OVERALL BIAS
OVERALL BIAS: BULLISH - Price has reclaimed the EMA21/EMA55/SMA50/VWAP cluster with a fresh MACD bullish crossover, ADX above 25 with +DI well above −DI, and CMF at +0.17 showing accumulation. Room exists toward $57.2-58 resistance, and the trend remains above a rising SMA200.
This is educational analysis and not financial advice.