AMZN 27-day bullish forecast — Nov 1, 2026
- Bias: Bullish
- Timeframe: 27 days (made Nov 1, 2026, target date Nov 27, 2026)
- Price at analysis: $240.35
- Price target: $246.50
- Expected range: $229.00 – $262.00
- Result: Pending — graded after the close on Nov 27, 2026
Get a free AI analysis of AMZN today
Analysis
TECHNICAL INDICATORS
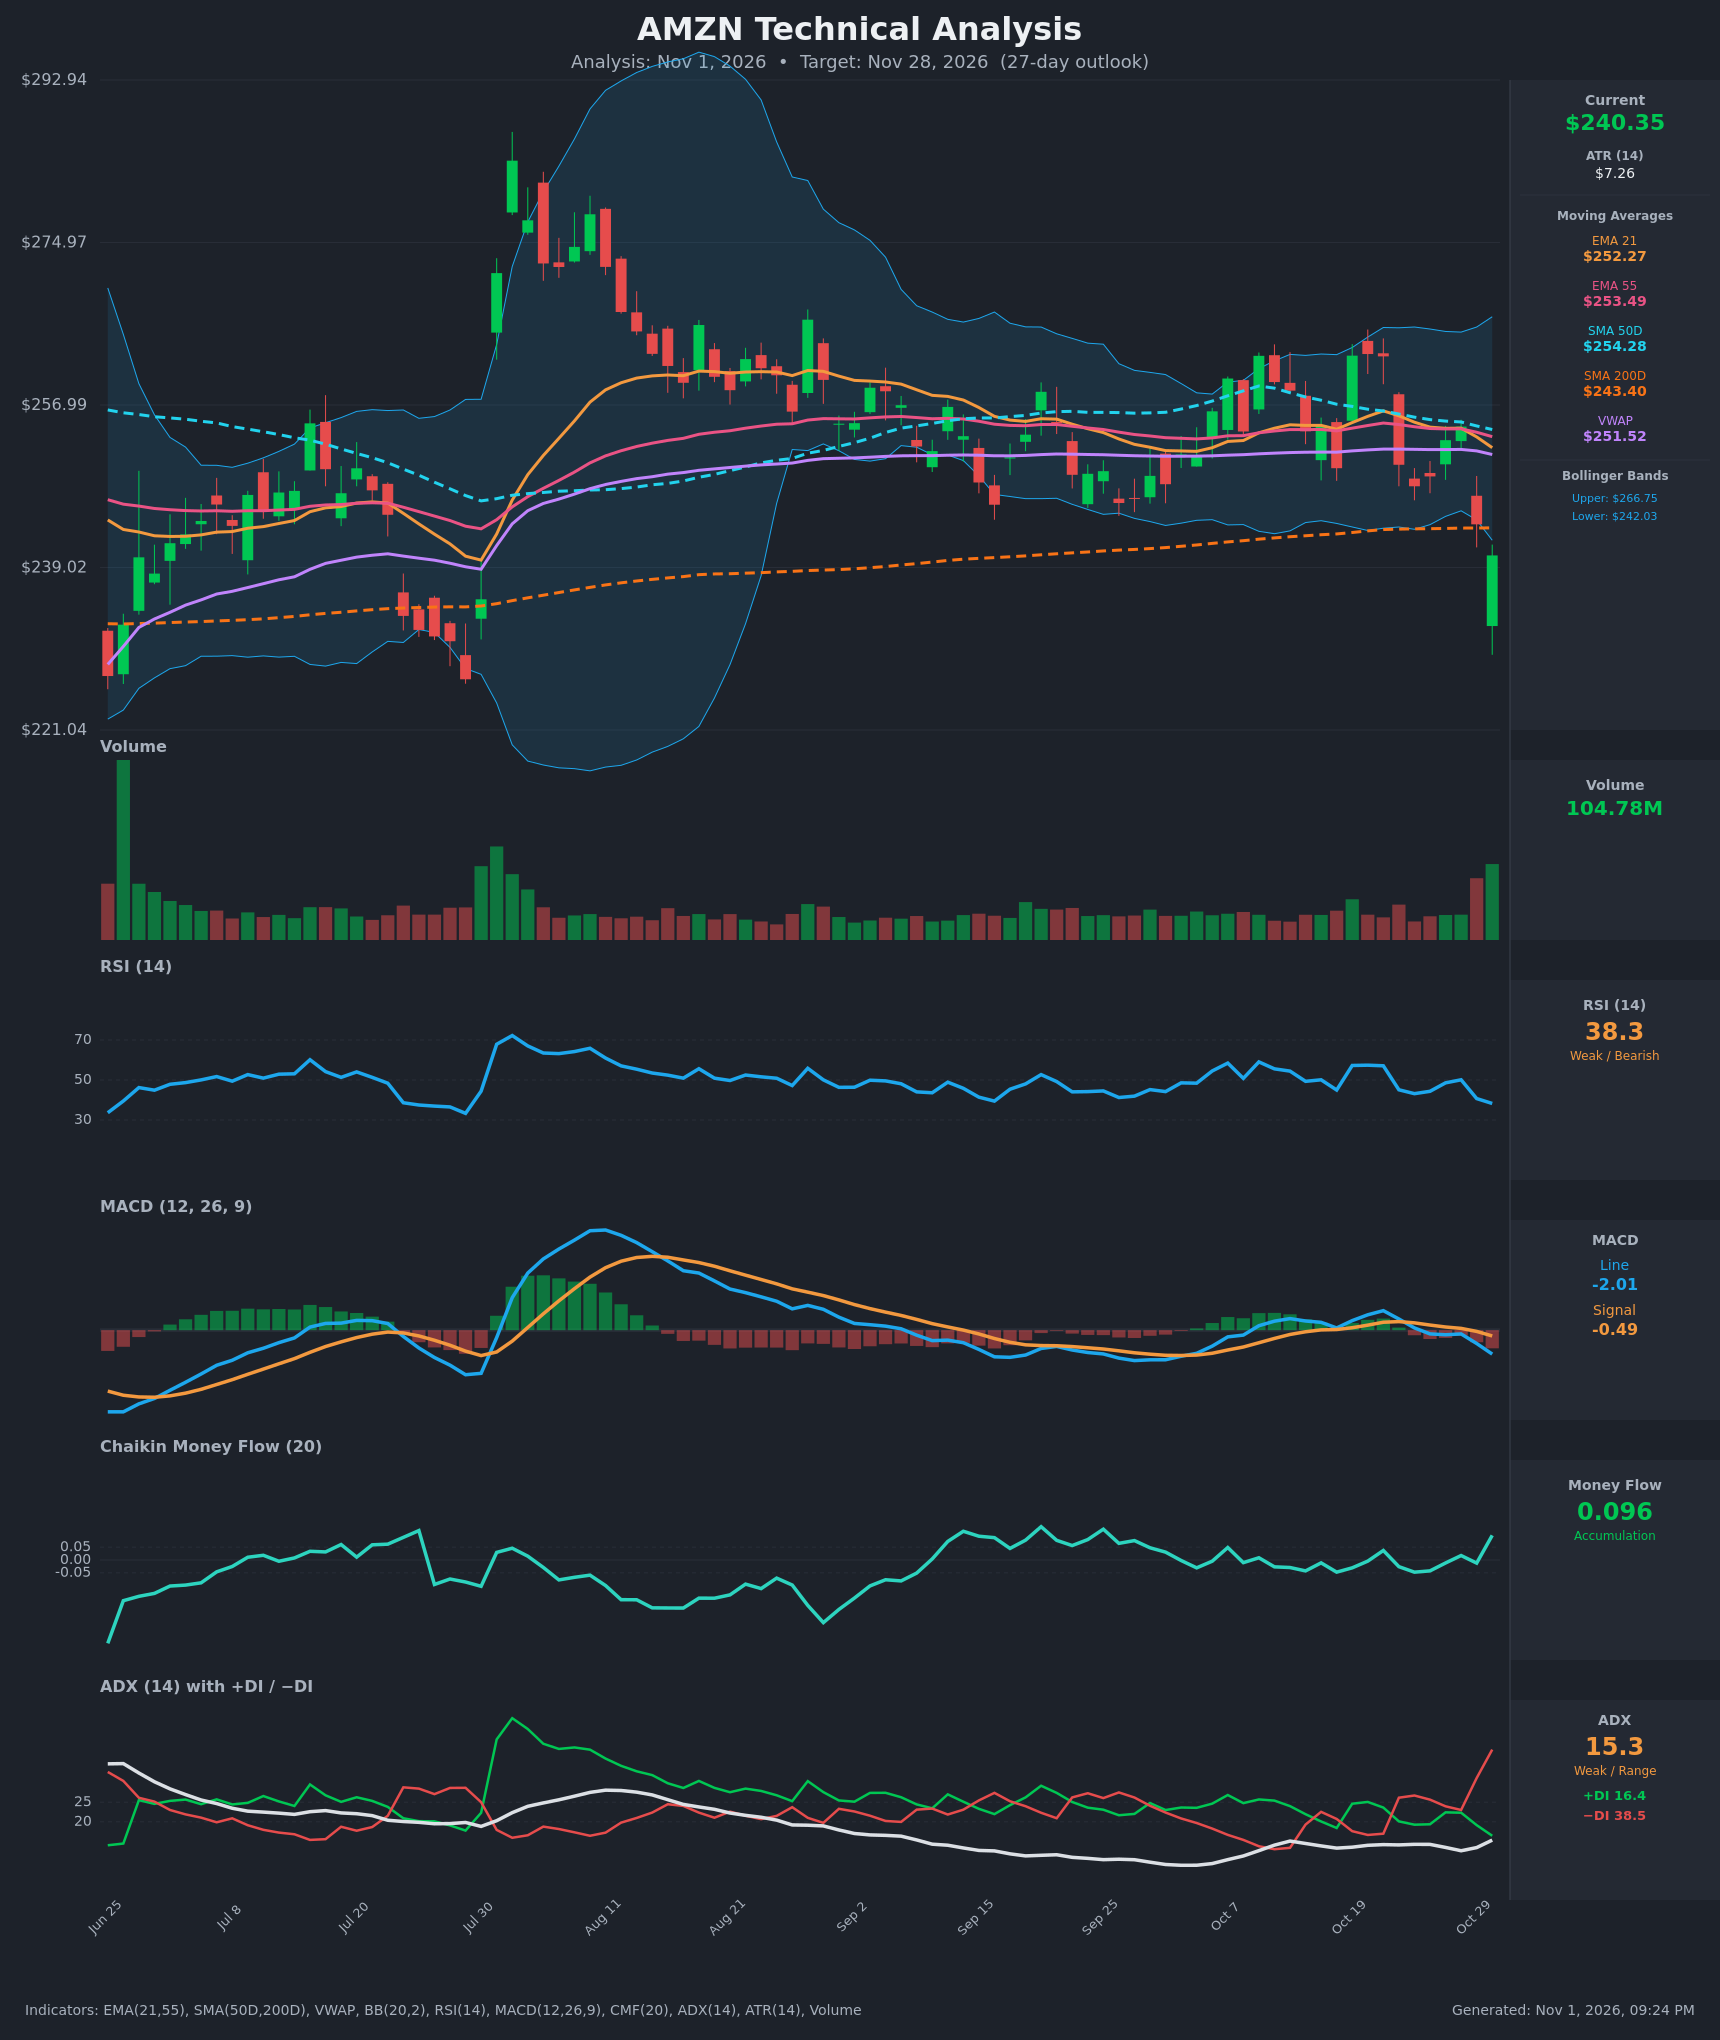
- RSI (14): 38.26, down from 50.1 on Oct 28 and 57 on Oct 20. It is weak and approaching oversold but not there yet. Momentum is still falling. [Bearish]
- 20 EMA: The supplied value is the EMA 21 at $252.27, with the EMA 55 at $253.49. Price at $240.35 is about 4.7% below the EMA 21, which is now overhead resistance. The EMA 21 has crossed below the EMA 55, which is a short-term bearish signal. [Bearish]
- MACD: The line at -2.01 is below the signal at -0.49 after a bearish crossover around Oct 26-29. The histogram is negative and widening, so downside momentum is accelerating. [Bearish]
- Bollinger Bands (20): Price at $240.35 is below the lower band ($242.03), which is a stretched, statistically extended reading. The bands are narrow-to-moderate ($242 to $267), and the middle band is near $254. Closes outside the band in a weak-ADX environment often mean-revert, though they can also mark a breakdown. [Neutral]
- CMF (20): 0.096, above the +0.05 threshold. It has jumped from -0.012 on the prior day, which suggests dip-buying on the heavy-volume gap down. It diverges from the price weakness. [Accumulation]
- ADX (14): 15.3 with −DI at 38.5 and +DI at 16.4. The trend is weak by ADX, but the DI spread is wide and bears are clearly in control of the latest move. ADX is just starting to turn up. [Weak Trend, bearish direction]
- Volume: 104.78M, one of the heaviest bars in months. It is a high-volume gap down with a green close. This suggests capitulation or an earnings-driven repricing, with buyers absorbing supply near the SMA200. [Climactic, possible exhaustion]
Other moving averages:
- SMA 200D: $243.40. Price has closed just below this long-term trend line. It was a support zone and is now the first overhead level.
- SMA 50D: $254.28, with the 50D still above the 200D (no death cross).
- VWAP: $251.52, above price.
DIVERGENCES & TRENDS
- CMF divergence: CMF has turned positive (0.096) while price made a new low for the move. This is a bullish divergence that points to absorption of selling.
- RSI and MACD: Both are making fresh lows with price. They confirm the downside move and show no bullish divergence yet.
- DI spread: −DI surged from 19 to 38.5 in two sessions. Meanwhile ADX is at only 15, so this is a sharp shock move inside a long consolidation rather than an established downtrend.
- Crossovers:
- The EMA 21 has crossed below the EMA 55.
- The MACD has crossed bearish.
- Price has lost the SMA 200D.
- The −DI/+DI crossover is bearish.
- Range context: Since early August, price has oscillated between about $240 and $265. The current level sits at the bottom of that range.
CHART PATTERNS
- Broad range / rectangle: The August–October action is a sideways range of roughly $240–$265, with repeated support tests near $240–$243 (the SMA200 zone). This resembles the multi-touch structure of a triple-top/bottom range.
- Bearish risk: A decisive close below roughly $238–$240 would break the range and open a measured move toward $225–$230. The earlier July base is near $228–$232.
- Bullish possibility: A hold above $232–$235 with a reclaim of the SMA200 ($243.40) would turn this into a failed breakdown or bear trap. That would target the range midpoint at about $252–$254 (EMA 21, EMA 55, VWAP, SMA 50D cluster).
- No clean reversal pattern is complete yet. The gap down is the dominant event.
POTENTIAL SCENARIOS
- Scenario 1: Bullish Mean-Reversion Bounce — The oversold gap-down is absorbed (positive CMF, heavy-volume green close), and price reclaims the SMA200 and drifts back toward the moving-average cluster. Trigger: daily close above $243.40, then above $247. Target: $250–$254 (EMA 21 / VWAP / EMA 55 zone). Invalidation: daily close below $232. (45% probability)
- Scenario 2: Bearish Range Breakdown — Bears keep control (−DI 38.5, MACD widening) and the post-gap weakness extends below the range floor. Trigger: close below $236 on rising volume. Target: $225–$230. Invalidation: close back above $247. (40% probability)
- Scenario 3: Neutral Chop Below Resistance — Price stays pinned between about $233 and $250 with weak ADX. Trigger: failed attempts at the EMA 21 and SMA200 with no follow-through. Target: $238–$246. Invalidation: close outside $230–$252. (15% probability)
PRICE TARGETS
- Target Price: $246.50 (27-day horizon, Nov 28, 2026)
- Expected Range: $229.00 to $262.00 (width $33.00, about 13.7% of current price, consistent with the 30-60 day guidance of 12-18%)
- Key Levels: Support at $232.00, Resistance at $252.27
OVERALL BIAS
OVERALL BIAS: BULLISH - Price is stretched below the lower Bollinger Band on climactic volume. CMF has turned positive and the stock sits at the floor of a multi-month range near the SMA200, so a modest mean-reversion toward $246-$252 is slightly more likely than a breakdown. Conviction is modest, since MACD, the DI spread, and the moving-average structure all remain bearish. A close below $232 would invalidate this view.
This is educational analysis and not financial advice.