AAL 27-day bullish forecast — Nov 1, 2026
- Bias: Bullish
- Timeframe: 27 days (made Nov 1, 2026, target date Nov 27, 2026)
- Price at analysis: $12.60
- Price target: $13.00
- Expected range: $11.65 – $13.75
- Result: Pending — graded after the close on Nov 27, 2026
Get a free AI analysis of AAL today
Analysis
TECHNICAL INDICATORS
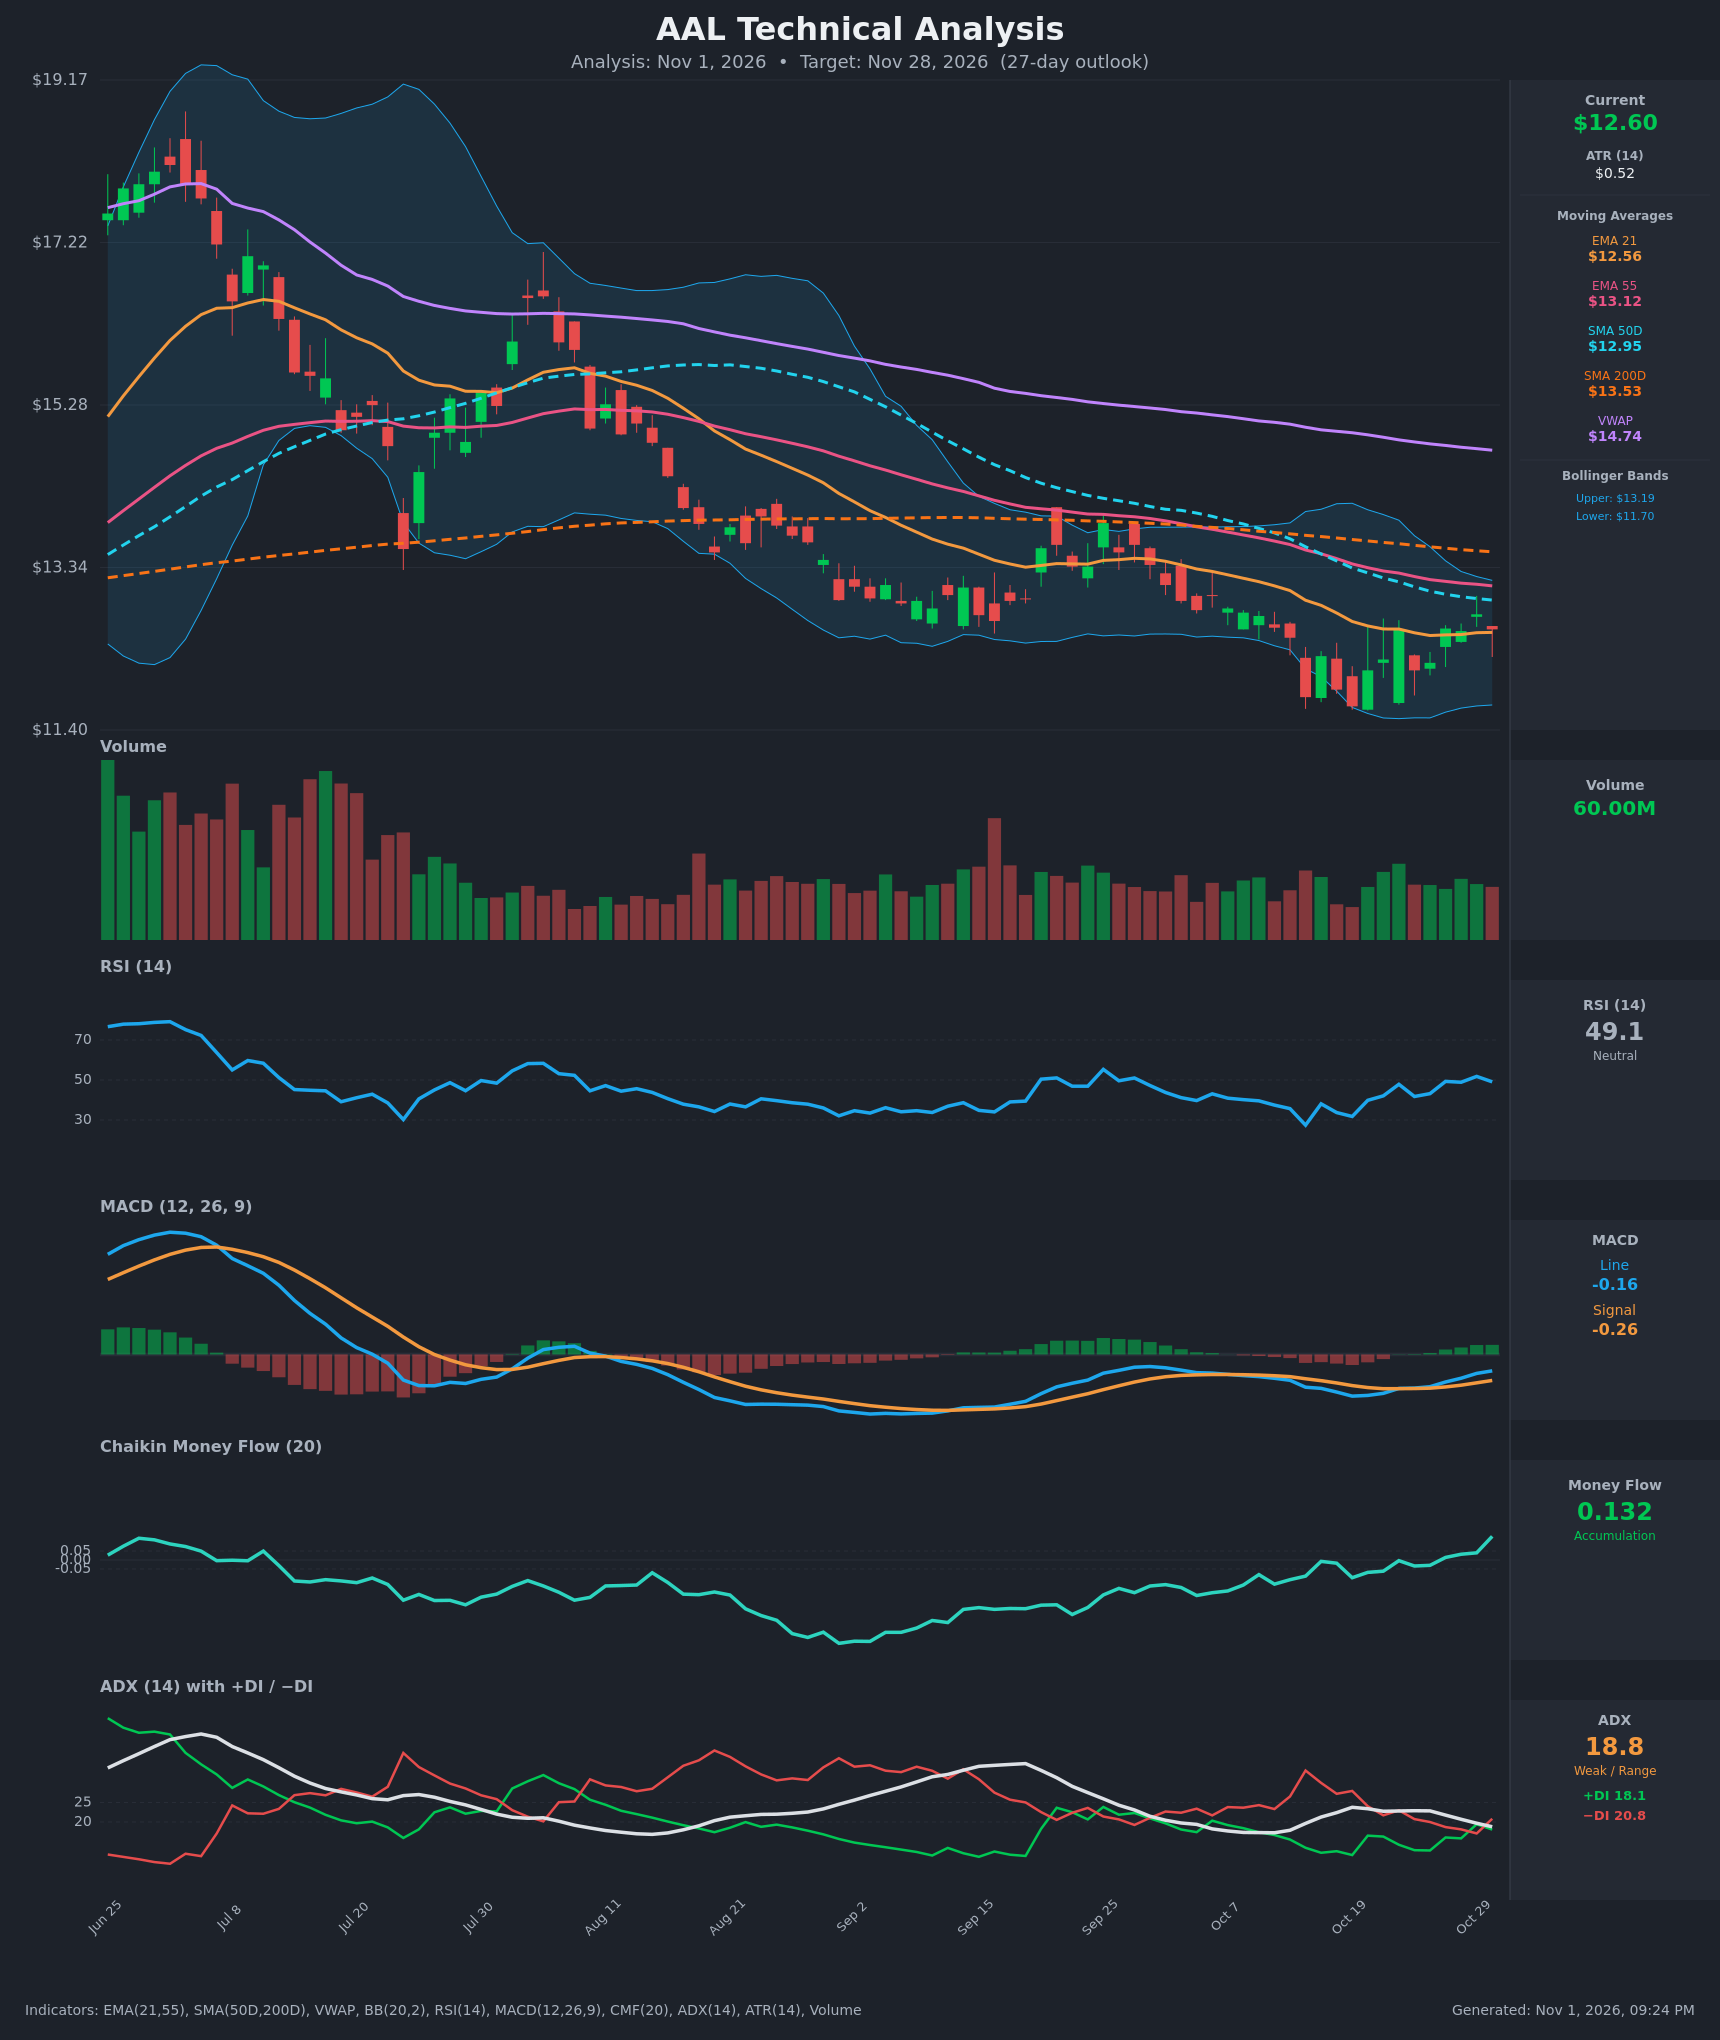
- RSI (14): 49.08, right at the midline. It has recovered from the oversold 27.4 on Oct 14 and has held between 42 and 52 over the last week. Momentum is stabilizing rather than accelerating. [Neutral]
- 20 EMA (EMA 21): $12.56, with price at $12.60 just above it. The EMA21 has flattened after a steep decline and now acts as marginal support. EMA55 ($13.12), SMA50D ($12.95), SMA200D ($13.53) and VWAP ($14.74) all sit overhead as layered resistance. [Neutral]
- MACD: Line -0.164 is above Signal -0.260, after a bullish crossover around Oct 22. The histogram is positive and expanding, but both lines are still below zero, so this is a recovery from a bearish regime and not yet a confirmed trend change. [Bullish]
- Bollinger Bands (20): Upper $13.19, lower $11.70, so the bands are narrowing after the volatility expansion in October. Price is slightly above the midline (~$12.44) after bouncing off the lower band. The squeeze suggests a directional move is coming, and the upper band overlaps the SMA50D/EMA55 resistance. [Neutral]
- CMF (20): 0.132, well above +0.05 and rising from -0.135 on Oct 12. It has been positive for 4 sessions and is climbing, which points to genuine accumulation during the bounce. [Accumulation]
- ADX (14): 18.8 and falling, so the trend is weak or range-bound. −DI (20.8) is back above +DI (18.1) after a brief +DI lead on Oct 29, so there is a slight bearish tilt but no real directional control. [Weak Trend, slight bearish tilt]
- Volume: 60.00M, in line with the recent average. There was no capitulation spike on the Oct 14–19 lows, and volume on the green bounce candles is similar to or slightly above that on the red ones. [Neutral to mildly constructive]
DIVERGENCES & TRENDS
- Price made lows of $11.79 on Oct 14 and $11.68 on Oct 19. RSI made a higher low on the second test (27.4, then 31.8) and has since climbed to ~49. MACD and CMF also turned up from those lows, a mild bullish divergence/base-building signal.
- CMF has swung from deeply negative (-0.135) to +0.132, the strongest money-flow improvement of the whole downtrend.
- The MACD bullish crossover (Oct 22) is confirmed by a growing histogram, but it is still below the zero line.
- The long-term trend is still down. Price is below the SMA200D ($13.53), EMA55, SMA50D and VWAP. EMA21 is below EMA55 and SMA50D is below SMA200D, so the death-cross structure remains in place, though the gaps are narrowing.
- The ADX decline from ~23 to 18.8 shows the selloff has lost steam, and the market is shifting toward consolidation or a base.
CHART PATTERNS
- Bullish Double Bottom (reversal): The lows near $11.68–$11.79 (Oct 14 and Oct 19) form a rough double bottom. The neckline is around $12.80–$13.00, near the recent swing high and SMA50D. A close above $13.20 would complete it, with a measured move of about $1.15 (neckline to low), or roughly $14.00–$14.20.
- Bollinger squeeze / consolidation: Price is coiling between $11.70 and $13.20, approaching a Symmetrical Triangle-style compression. A breakout in either direction is likely within the 27-day window.
- Bearish risk: A failure at the $13.00–$13.19 resistance cluster would turn this into a lower-high continuation within the larger downtrend (a bearish flag/pennant-like continuation) and retest $11.70.
POTENTIAL SCENARIOS
- Scenario 1: Bullish Double-Bottom Breakout — The base holds, accumulation continues and price pushes through the SMA50D/EMA55/upper-band cluster. Trigger: daily close above $13.20 on rising volume, with MACD moving above zero. Target: $13.50 (SMA200D) first, then $14.00. Invalidation: close below $12.10, then $11.68. (45% probability)
- Scenario 2: Bearish Rejection and Retest of Lows — Price fails at $13.00–$13.19, and −DI stays on top as the larger downtrend reasserts. Trigger: rejection at the SMA50D/EMA55 followed by a close below EMA21 ($12.56) and then $12.10. Target: $11.70, with an extension to $11.30. Invalidation: close above $13.20. (30% probability)
- Scenario 3: Neutral Range Chop — With ADX below 20 and the bands squeezing, price oscillates between $12.10 and $13.10 without a decisive break. Trigger: continued low-ADX, mixed-volume action. Target: $12.40–$12.80. Invalidation: a close outside the $11.70–$13.20 range. (25% probability)
PRICE TARGETS
- Target Price: $13.00 (27-day)
- Expected Range: $11.65 to $13.75 (width $2.10, about 16.7% of the current price, consistent with the 30–60 day guidance of 12–18% for a 27-day horizon)
- Key Levels: Support at $12.10, Resistance at $13.12
OVERALL BIAS
OVERALL BIAS: BULLISH - Money flow (CMF +0.132) is strongly improving, MACD has crossed up with an expanding histogram, and a double-bottom base is forming near $11.70, with price back above EMA21. The case is modest because price is still below every major moving average and −DI is above +DI, so a close above the $13.00–$13.20 resistance cluster is needed for confirmation.
This is educational analysis and not financial advice.