AAPL 27-day bearish forecast — Nov 1, 2026
- Bias: Bearish
- Timeframe: 27 days (made Nov 1, 2026, target date Nov 27, 2026)
- Price at analysis: $344.63
- Price target: $336.50
- Expected range: $318.00 – $362.00
- Result: Pending — graded after the close on Nov 27, 2026
Get a free AI analysis of AAPL today
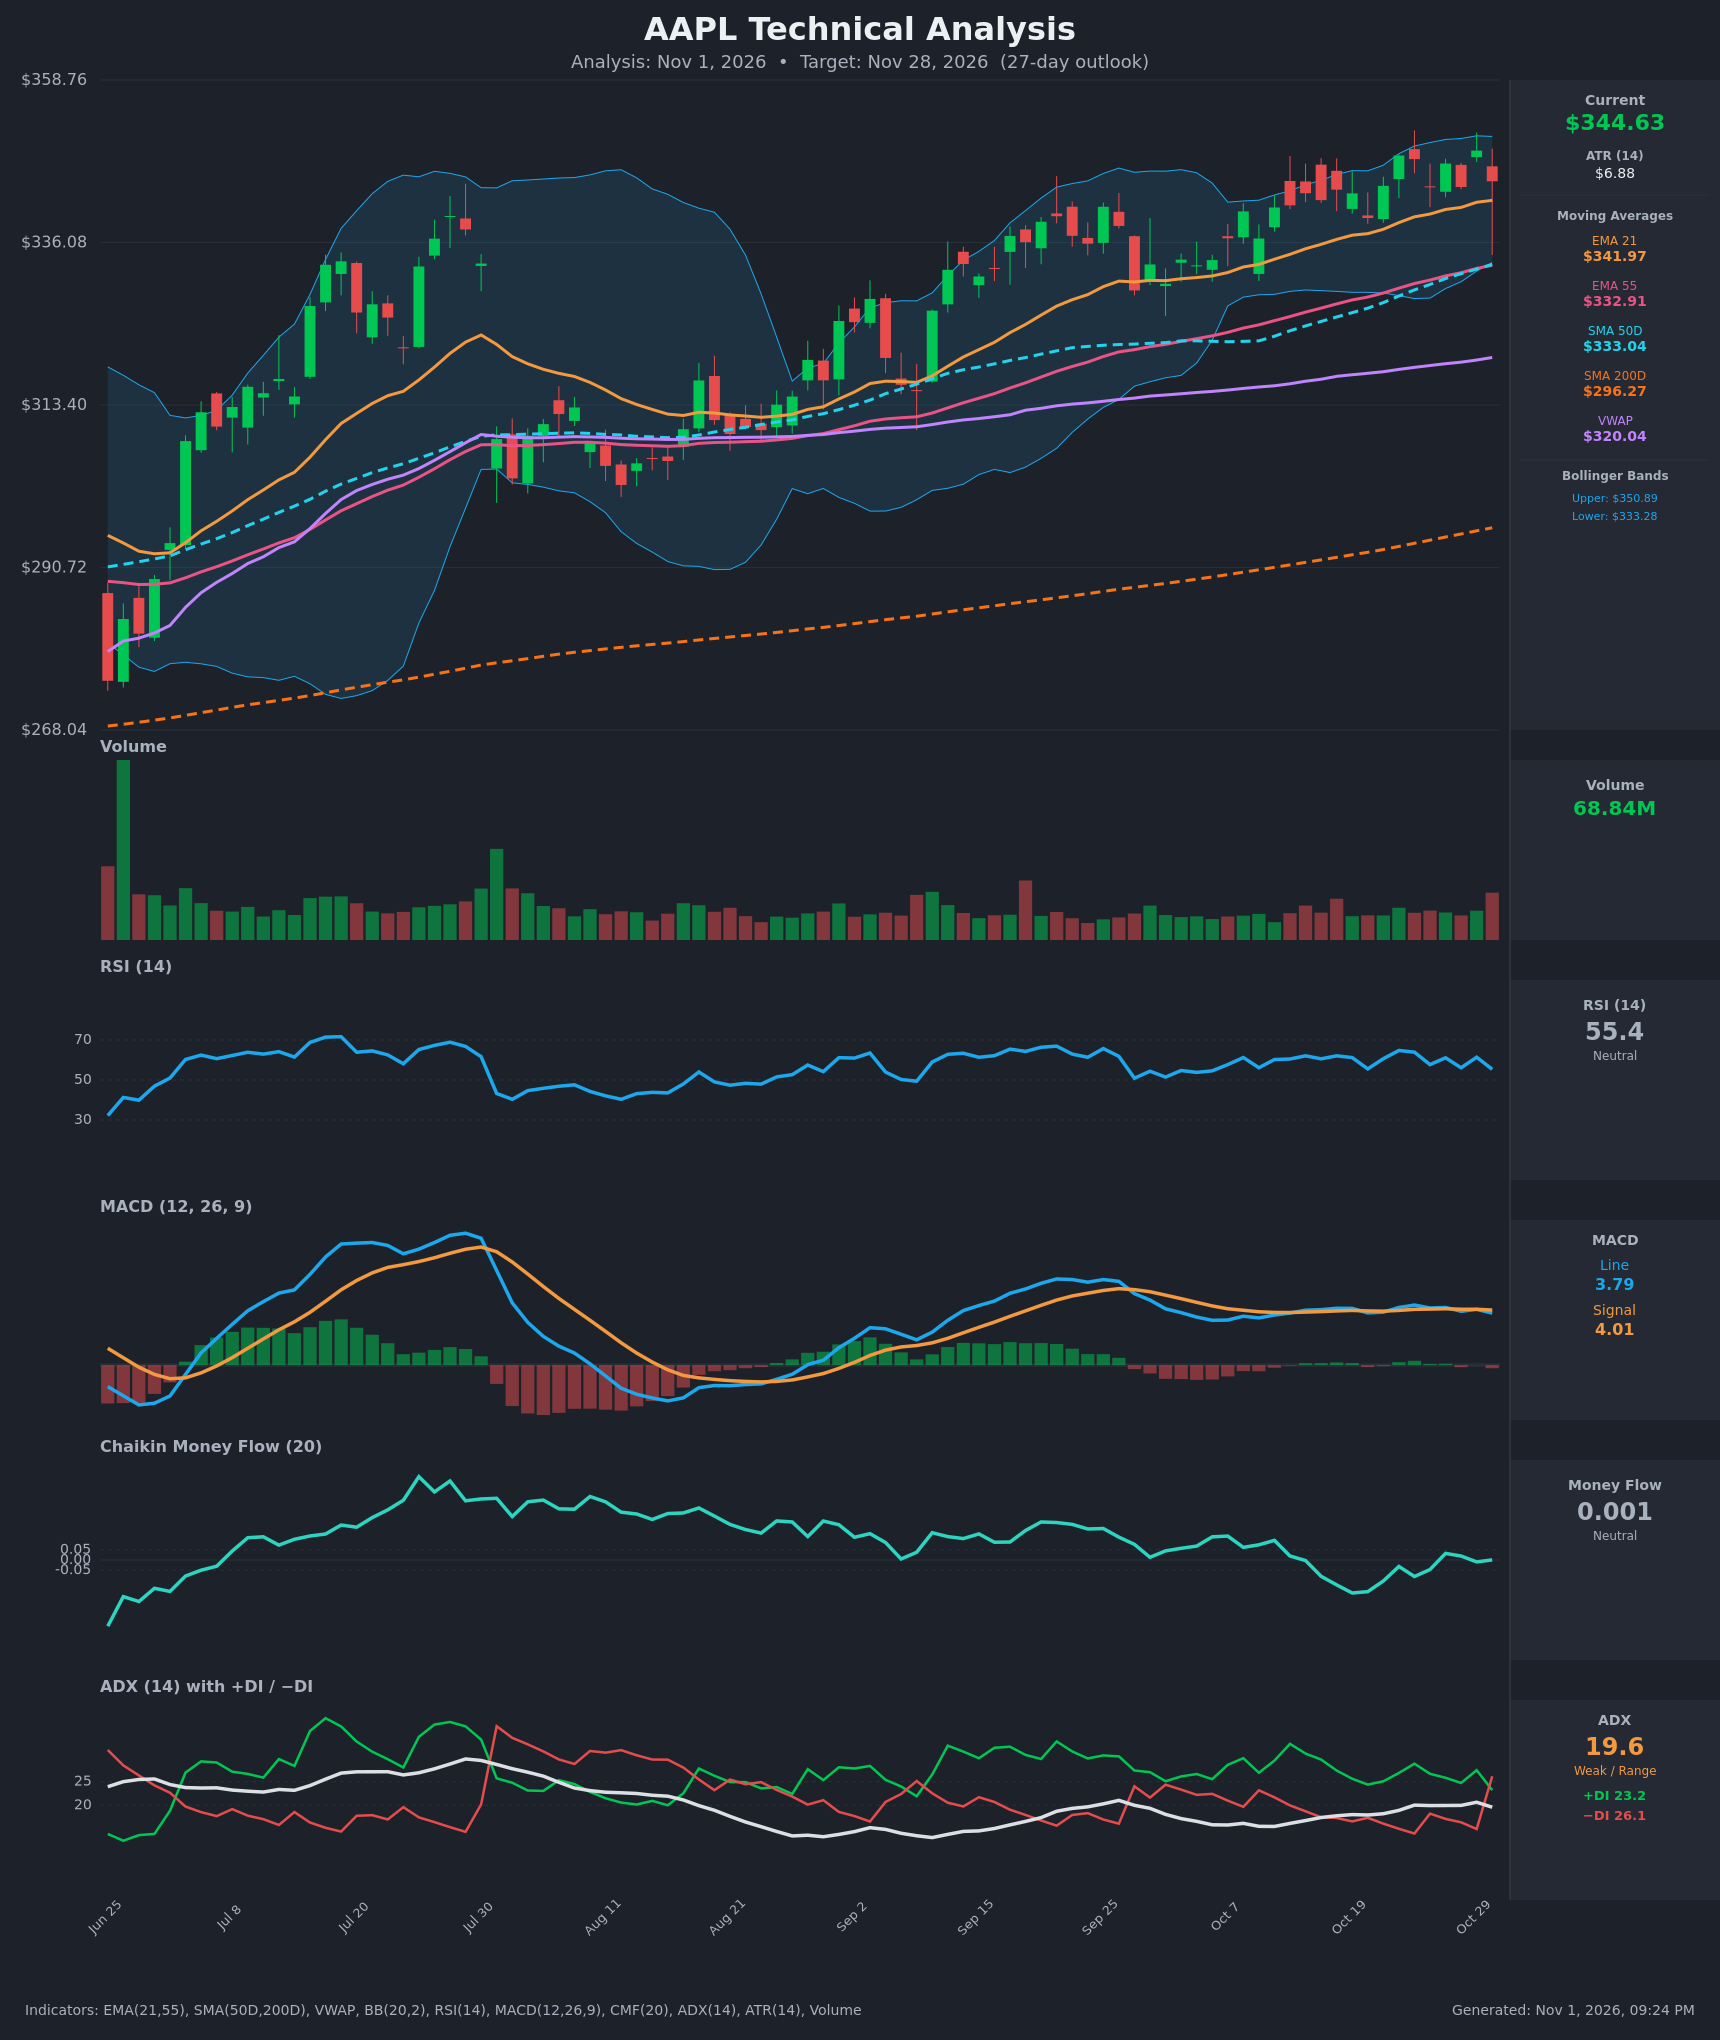
Analysis
TECHNICAL INDICATORS
- RSI (14): 55.35, down from 61-65 in late October. It is in neutral territory with momentum fading and lower highs since Oct 22 (64.8). [Neutral]
- 20 EMA: The EMA21 is $341.97 and price ($344.63) is above it, so it acts as first support. EMA21 is well above EMA55 ($332.91), and the gap is widening only slowly, so the EMA structure stays bullish. [Bullish]
- MACD: The line (3.79) has crossed below the signal (4.01) and the histogram is slightly negative. The line has been flat in the 3.8-4.4 range for weeks, so momentum has stalled and is rolling over. [Bearish]
- Bollinger Bands (20): The bands are $333.28 to $350.89, and price is in the upper half near the ~$342 midline. It has been rejected repeatedly near the upper band (~$349). The bands are narrow, which points to compression and a possible expansion. [Neutral]
- CMF (20): 0.001, down from +0.096 on Oct 12. It spent most of the last two weeks negative and sits at zero. Buying pressure has dried up and there is no accumulation to support new highs. [Neutral]
- ADX (14): 19.6 with +DI at 23.2 and −DI at 26.1. The trend is weak (<20), but −DI just spiked above +DI, a fresh bearish DI crossover. [Weak Trend, bearish tilt]
- Volume: 68.84M on the latest bar, which is a red candle with a long lower wick. Volume is average to slightly elevated on this down day, and there was no strong volume expansion on the push to $349. [Mild distribution / lack of breakout confirmation]
DIVERGENCES & TRENDS
- Price is making roughly equal highs at $347-349 (Oct 22, Oct 27, Oct 29) while RSI peaks lower (64.8, 61.1, 61.4) and MACD is flat to lower. This is mild bearish divergence.
- Long-term trend is intact. Price is above SMA200D ($296.27), SMA50D ($333.04) and VWAP ($320.04). SMA50D has been above SMA200D for a long time (the golden cross is long past). EMA21 is above EMA55, so there is no bearish EMA cross.
- Short-term signals are rolling over:
- MACD bearish crossover on Oct 28-30.
- −DI crossed above +DI on Oct 30.
- CMF fell from +0.096 to zero.
- The MACD/signal gap is small, so this is early and not yet decisive. The Oct 30 close back below $345 after a $348.91 print is a bearish reversal-type bar.
CHART PATTERNS
- Bearish Triple Top / Double Top (loose): The $347-349 area has been tested three times in the past 7 sessions (Oct 22, Oct 27, Oct 29). The "neckline" is the ~$339.50 low (Oct 20). A close below it would project a measured move of about $9-10 to roughly $330. That is a developing pattern, not a confirmed one.
- Bullish context: The larger structure is an uptrend with higher highs and higher lows since August. A clean break above $349 would invalidate the top pattern and resume the trend toward $355-358.
- The pattern is consistent with a consolidation or pullback toward the $333 confluence zone (SMA50D, EMA55, lower BB).
POTENTIAL SCENARIOS
- Scenario 1: Bearish Triple-Top Pullback — Price fails again at $348-349 and loses the $339.50 swing low, then drifts toward the SMA50/EMA55 confluence. The MACD cross and −DI crossover play out. Trigger: daily close below $339.50. Target: $333-$336, with an extension to $330. Invalidation: daily close above $349.50. (45% probability)
- Scenario 2: Bullish Breakout and Trend Continuation — Buyers defend EMA21 and price breaks the $349 ceiling as the uptrend resumes, supported by the rising SMA200D and the bullish MA stack. Trigger: close above $349.50 on expanding volume with MACD re-crossing above signal. Target: $355-$360. Invalidation: close below $339.50. (35% probability)
- Scenario 3: Neutral Range Chop — Price oscillates between $339.50 and $349 with weak ADX and ends the window near the current price. Trigger: continued failure to break either side. Target: $340-$348. Invalidation: close outside the $333-$350 band. (20% probability)
PRICE TARGETS
- Target Price: $336.50 (27-day)
- Expected Range: $318.00 to $362.00 (width $44, about 12.8% of current price, in line with the 12-18% guidance for 30-60 day windows scaled to 27 days)
- Key Levels: Support at $333.04 (SMA50D / EMA55 / lower BB confluence), Resistance at $349.00
OVERALL BIAS
OVERALL BIAS: BEARISH - Short-term momentum has rolled over, with a bearish MACD crossover, −DI overtaking +DI, CMF fading to zero, and repeated rejection at $347-349 forming a loose triple top. The long-term uptrend (above SMA200D) should limit the downside to the $333 support zone.
This is educational analysis and not financial advice.