SOXS 20-day bearish forecast — Nov 1, 2026
- Bias: Bearish
- Timeframe: 20 days (made Nov 1, 2026, target date Nov 20, 2026)
- Price at analysis: $52.08
- Price target: $47.80
- Expected range: $44.50 – $51.00
- Result: Pending — graded after the close on Nov 20, 2026
Get a free AI analysis of SOXS today
Analysis
TECHNICAL INDICATORS
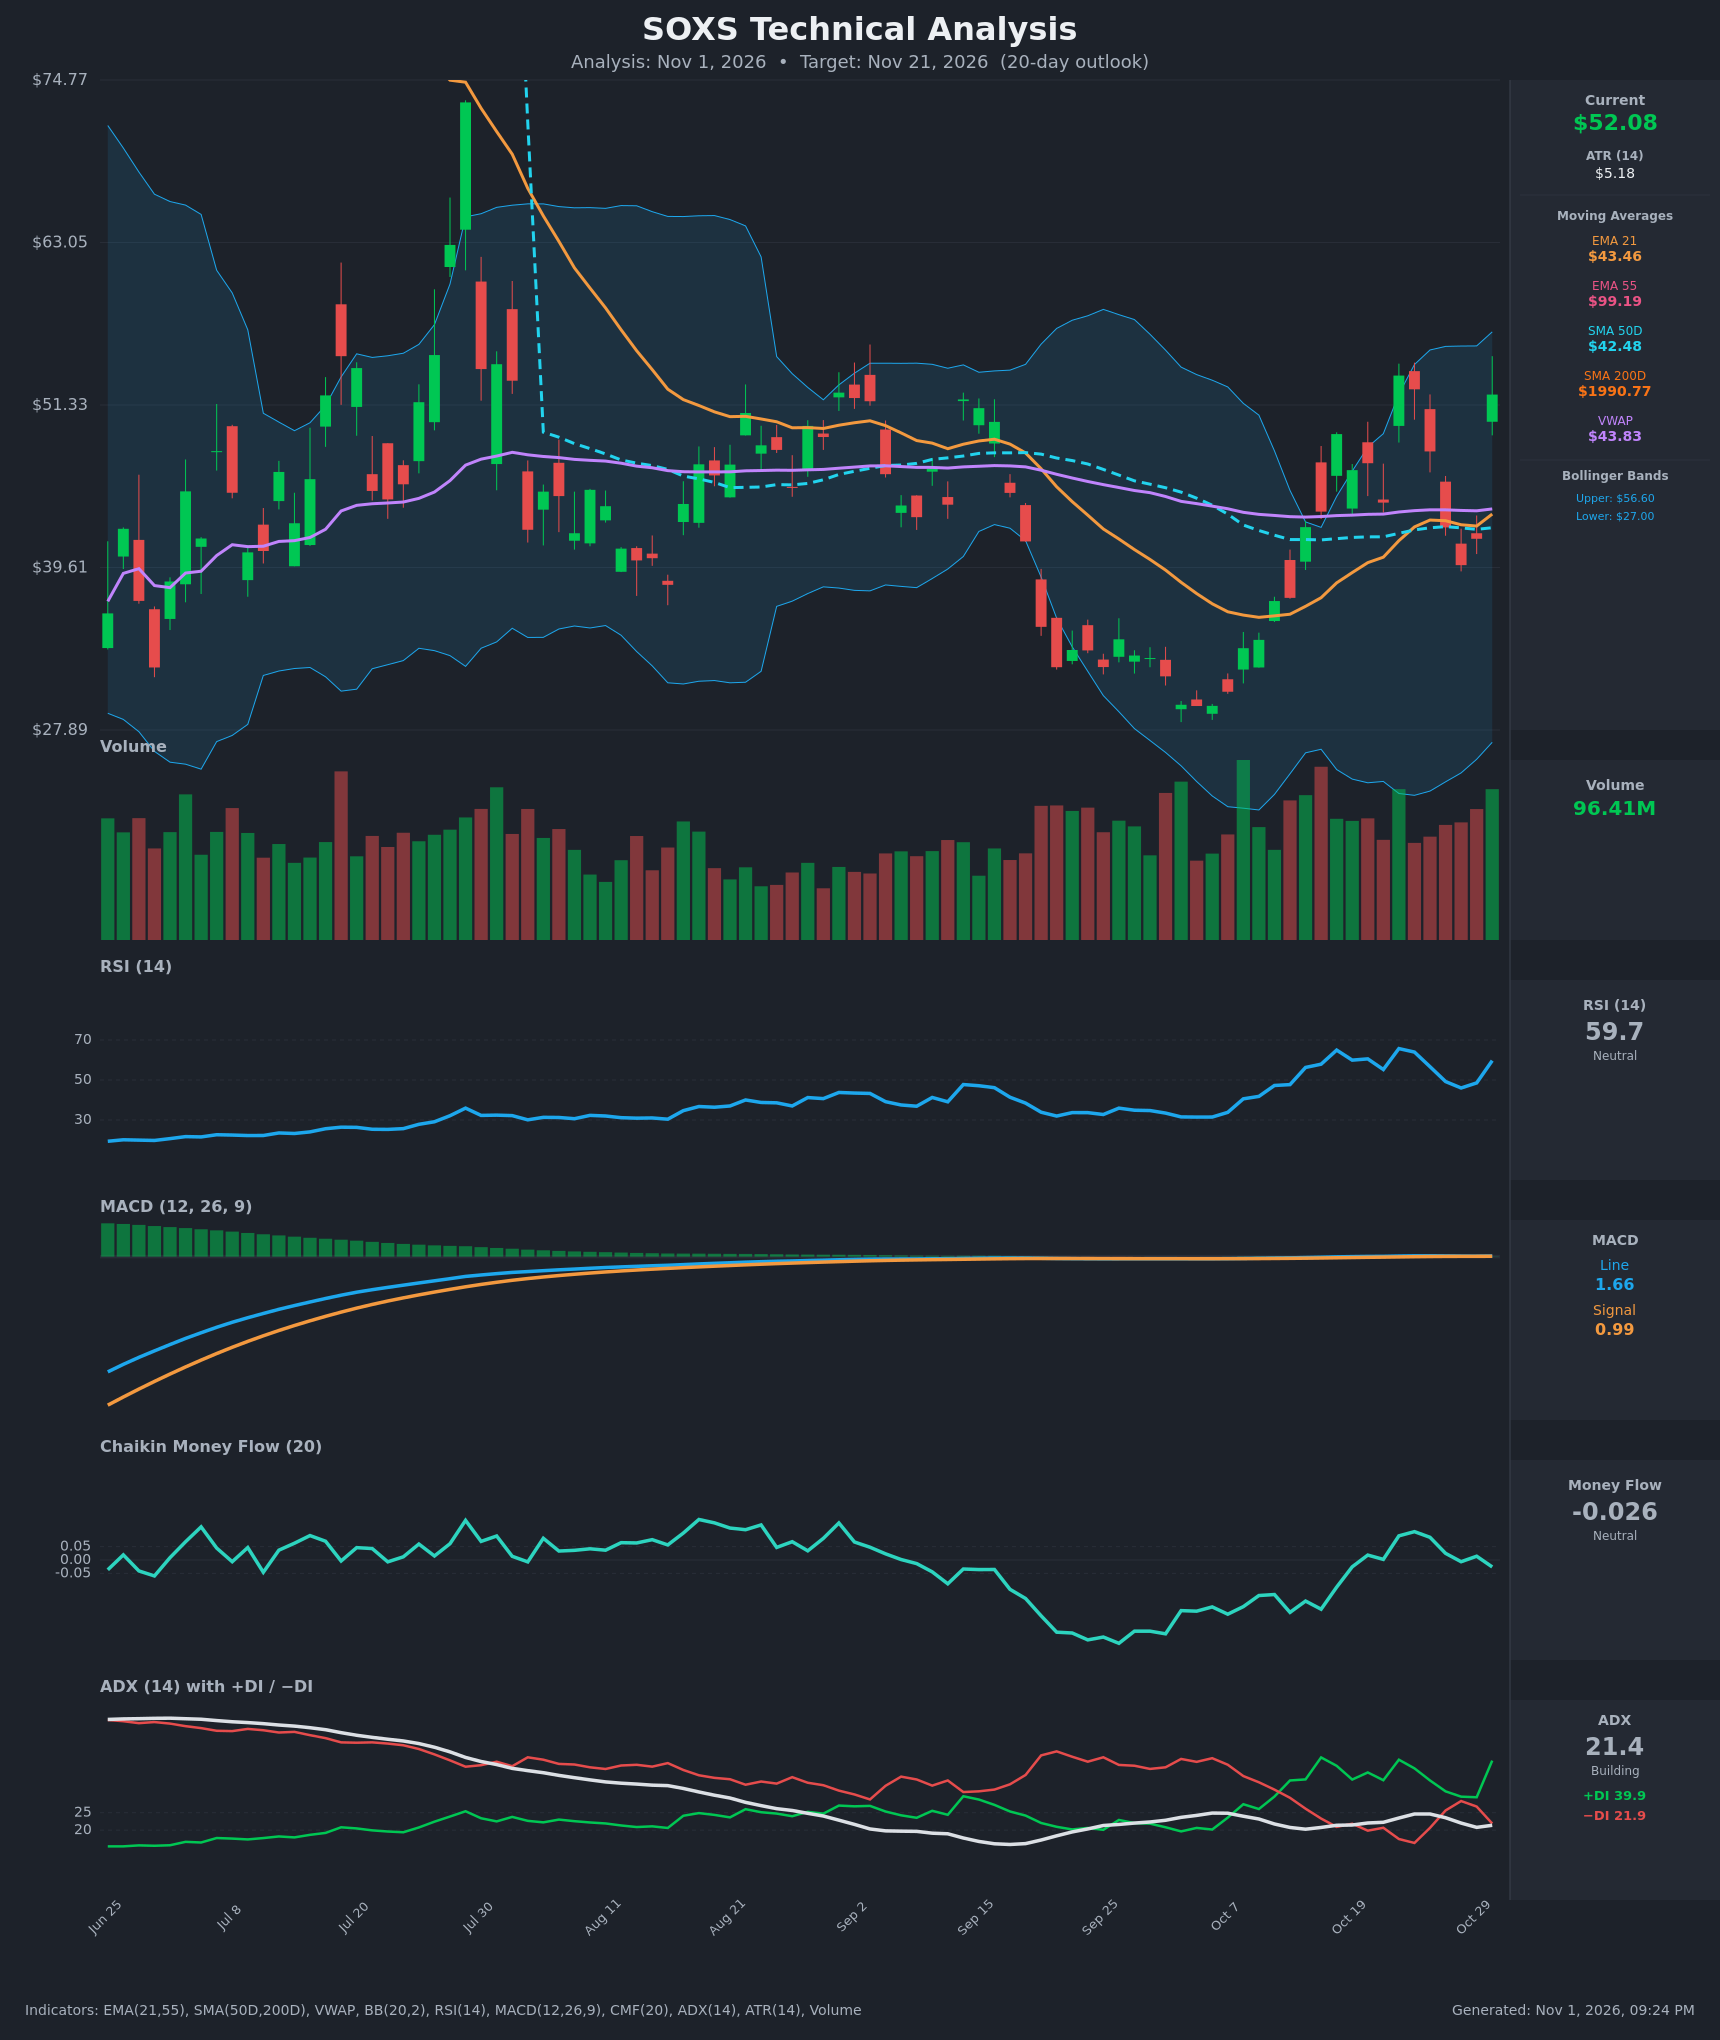
- RSI (14): 59.69, up from 48.5 two days ago after a +25% one-day spike. It is in the upper half of the neutral zone and not yet overbought. Prior peaks at 65-66 (Oct 16 and Oct 22) were followed by pullbacks. [Neutral]
- 20 EMA (EMA 21 = $43.46): Price at $52.08 is about 20% above it, so the EMA is dynamic support. That stretch is extreme, and the last such extension (Oct 22) reverted quickly. The EMA 55 ($99.19) and SMA200D ($1,990.77) look distorted by split adjustments, so I'm ignoring them. [Bullish]
- MACD: Line 1.66 is above signal 0.99, with a positive and re-expanding histogram. The line crossed above signal on Oct 26 and re-widened after the Oct 30 spike. Momentum is positive but lags the whipsaw price action. [Bullish]
- Bollinger Bands (20): Upper $56.60, lower $27.00, so the bands are very wide (about $29.60) and show extreme volatility. Price is in the upper third, about $4.50 below the upper band, with the midline near $41.80. Moves back toward the mid-band have followed each push to the upper half. [Neutral]
- CMF (20): -0.026 is inside the ±0.05 neutral band. It has faded from +0.106 on Oct 23. The rally is not being confirmed by accumulation. [Neutral]
- ADX (14): 21.4 with +DI 39.9 and −DI 21.9. +DI is on top, but ADX is barely above 20, so this is a weak, choppy trend. The DI lines have flipped repeatedly in the last 15 bars. [Weak Trend, bullish tilt]
- Volume: 96.41M, among the highest recent bars, on a large green candle. It is a strong buying burst, but similar spikes (Oct 16, Oct 22) did not hold. [Bullish short-term, unsustained]
- VWAP / SMA50D: VWAP is $43.83 and SMA50D is $42.48, both well below price. The 50D average is flat, which suggests mean-reversion levels. [Neutral]
DIVERGENCES & TRENDS
- RSI is lower than at the Oct 22 high (65.7 vs 59.7) while price is nearly the same ($53.45 vs $52.08). That is a mild bearish divergence at resistance.
- CMF peaked on Oct 23 and has been drifting down, which is a mild distribution warning against the price strength.
- MACD is positive and above signal, so trend momentum has turned up from the Oct 7 low near $29. That is a real bullish structural change.
- Price has shown a repeated spike-and-fade pattern: $49.23 → $44.29, then $53.45 → $39.78, now $52.08. Gains have been given back within 2-5 sessions.
- ADX is flat near 21-24 and has not confirmed a strong trend. The DI spread is wide only because of the single-day spike.
- The EMA 21 / SMA50D are converging at about $43, and price is far above both, which makes the stretch vulnerable.
CHART PATTERNS
- Bearish Triple Top / Double Top (reference diagram): Highs at $53.45 (Oct 22), $52.46 (Oct 23) and $52.08 (Oct 30) form a loose resistance zone at $52-53.5. The neckline is near $39.78-$42.50, so a failure here targets roughly $40-$43, with the measured move going lower. It is not confirmed until price breaks the neckline.
- Larger structure: The recovery from $29 forms higher lows ($37.2 → $39.8), which is bullish. A close above $53.50 on volume would break the triple-top zone and open $56.60 (upper band), then the $60s.
- Overall: The structure is a volatile range of about $40-$53.5 with a repeatedly tested top. Probability favours a rejection or pullback from the top of the range, with a lower-conviction bullish breakout alternative.
POTENTIAL SCENARIOS
- Scenario 1: Bearish Rejection at Triple-Top Resistance — Price fails again at $52-53.5, with the same spike-and-fade behaviour as Oct 16 and Oct 22. It retraces toward the EMA 21 / VWAP zone. Trigger: close below $47.50 and a MACD histogram contraction. Target: $47.80 by day 20, with an extension toward $43.50. Invalidation: daily close above $53.50 on strong volume. (50% probability)
- Scenario 2: Bullish Breakout Above $53.50 — The higher lows and positive MACD and DI structure carry price through resistance, completing a bullish reversal. Trigger: close above $53.50 with volume above 100M. Target: $56.60 (upper band), then $60. Invalidation: close back below $48. (32% probability)
- Scenario 3: Neutral Range Chop — Price oscillates between $44 and $53 with weak ADX and fades both extremes. Trigger: ADX stays near 20 and RSI stays 45-65. Target: about $49-$51. Invalidation: a daily close outside $43.50-$54. (18% probability)
PRICE TARGETS
Self-check: the 20-day range width is $51.00 − $44.50 = $6.50, which is 12.5% of $52.08. That fits the 14-21 day guidance of about 8-12% (slightly above the top end because ATR is about 10% per day). The range is wider than a 2-3 day range would be.
- Target Price: $47.80
- Expected Range: $44.50 to $51.00
- Key Levels: Support at $43.50 (EMA 21 / VWAP zone), Resistance at $53.45 (triple-top high)
OVERALL BIAS
OVERALL BIAS: BEARISH - Price is stretched about 20% above the EMA 21 after a +25% one-day spike, at a triple-top resistance of $52-53.5 where earlier spikes reversed. RSI is lower than at the prior high, and CMF is neutral and fading, with only weak ADX. The MACD and +DI tailwind keeps conviction modest, and a close above $53.50 would invalidate the call.
This is educational analysis and not financial advice.