AMD 27-day bearish forecast — Nov 1, 2026
- Bias: Bearish
- Timeframe: 27 days (made Nov 1, 2026, target date Nov 27, 2026)
- Price at analysis: $504.80
- Price target: $487.00
- Expected range: $447.00 – $527.00
- Result: Pending — graded after the close on Nov 27, 2026
Get a free AI analysis of AMD today
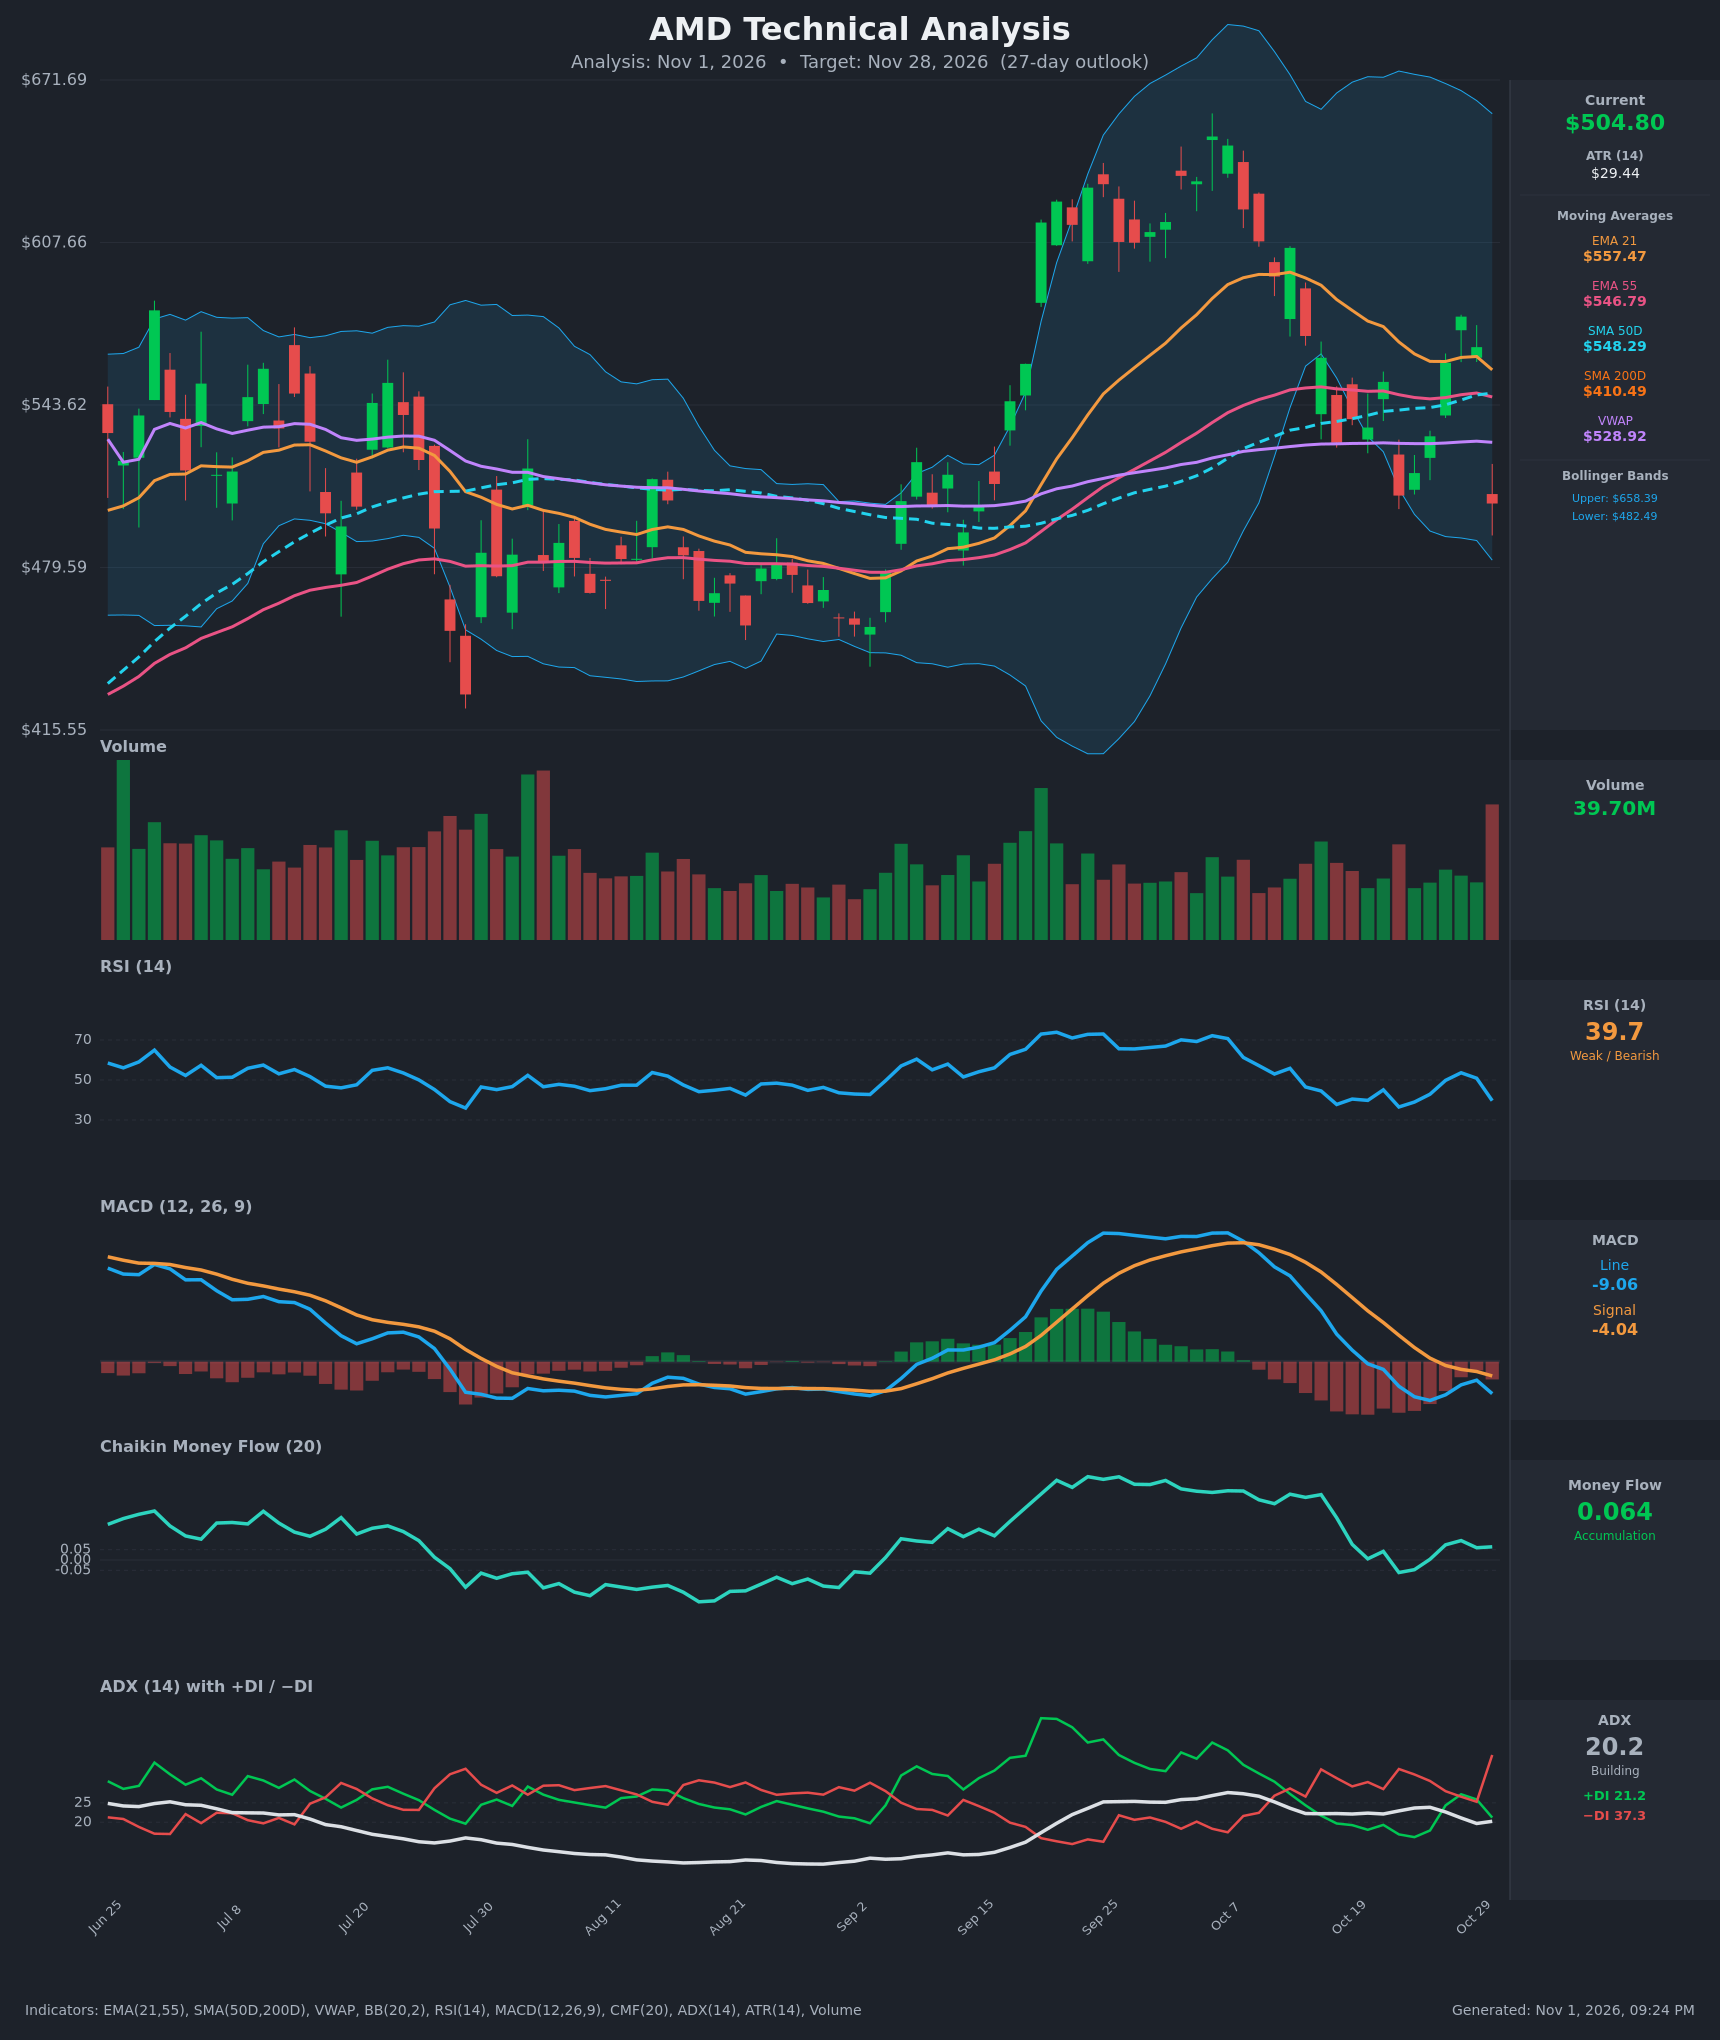
Analysis
TECHNICAL INDICATORS
- RSI (14): 39.67, down from 53.6 on Oct 28. It is in the weak zone but not oversold (<30). Momentum is clearly rolling over, and it has made lower highs since the early-Oct peak above 70. [Bearish]
- 20 EMA (EMA 21 = $557.47): Price at $504.80 is about 9.4% below it. The EMA is sloping down from ~$595 on Oct 13 and acts as overhead resistance. EMA 21 is still above EMA 55 ($546.79), but the gap has narrowed to under $11, so a bearish EMA cross is close. [Bearish]
- MACD: Line -9.06 is below Signal -4.04, and the histogram is negative at about -5. The line crossed below the signal around Oct 27-30 and crossed below zero on Oct 20. The recovery on Oct 27-29 failed, and the line is turning down again. [Bearish]
- Bollinger Bands (20): Upper $658.40, lower $482.49, so the bands are wide and starting to contract after the October volatility spike. Price is in the lower quarter of the bands, about $22 (4.6%) above the lower band. That favors a test of the lower band, although a bounce from there is also possible. [Bearish]
- CMF (20): 0.064, only just above the +0.05 accumulation threshold, and it has fallen from 0.3 in mid-Oct. Buying pressure has faded. This is the one mildly supportive reading, but it is marginal and deteriorating. [Neutral]
- ADX (14): 20.2 with −DI at 37.3 well above +DI at 21.2. The trend is not yet strong, but the 16-point DI spread shows bears firmly in control. The −DI spike on Oct 30 suggests ADX may rise above 25 if the selling continues. [Weak Trend, Bearish Direction]
- Volume: 39.70M on the Oct 30 red candle, the largest bar in the visible window, with a -10.9% daily drop. A heavy-volume breakdown candle is a sign of distribution or capitulation. [Bearish]
Other moving averages and price levels:
- Price is below VWAP ($528.92), SMA50D ($548.29) and EMA 55 ($546.79).
- Price is still well above SMA200D ($410.49), so the long-term trend is intact, although SMA50D is flattening.
DIVERGENCES & TRENDS
- There is no clear bullish RSI or MACD divergence. Price is making lower highs (605, 578, 566) while RSI and MACD make lower highs too, so momentum confirms price.
- The MACD bearish signal-line crossover is confirmed and the line is below zero. Momentum has swung from strongly positive (+26.9 on Oct 12) to negative within 3 weeks.
- −DI has moved decisively above +DI (the +DI/−DI cross happened Oct 13-15), and −DI just spiked.
- CMF has dropped from 0.3 to 0.06, which is a fading accumulation divergence against the recent price weakness.
- The price lost EMA 21, EMA 55, SMA50D and VWAP in sequence. The Oct 30 close of $504.80 is also below the Oct 22 swing low close of $507.93.
- A death cross is not in play. SMA50D ($548) is far above SMA200D ($410).
CHART PATTERNS
- Loose Bearish Double Top / failed breakout: Price peaked near $640-655 in late Sep and early Oct and then fell back through the prior consolidation zone. The lower edge of that zone is around $505-510, which is now being broken (Oct 22 low $507.93, now $504.80). A full measured move toward the $360s looks too aggressive given the SMA200D at $410.
- Lower highs / descending structure: The bounces of Oct 21, Oct 28 and Oct 29 failed at progressively lower levels, a mini descending-triangle-like structure with support near $505-508. A break below it points toward the lower Bollinger band ($482) and then the $450-460 area.
- Bullish counter-case: If price holds the $480-505 area and reclaims VWAP/EMA 55, it would form a broad range between roughly $480 and $580, and a double-bottom type base would form on any retest.
POTENTIAL SCENARIOS
- Scenario 1: Bearish Breakdown Continuation — Heavy-volume close below the $505-508 support with −DI dominant and MACD below signal. Price tests the lower Bollinger Band and then extends toward the mid-$400s. Trigger: daily close below $482.49. Target: $450-$460, with the potential for an extension to the ~$440s. Invalidation: daily close back above $529 (VWAP). (50% probability)
- Scenario 2: Bullish Mean-Reversion Bounce — Oversold-style bounce off the lower Bollinger Band, supported by CMF still marginally positive and the rising SMA200D far below. Price rebounds into the moving-average cluster. Trigger: reclaim of $529 (VWAP) on rising volume. Target: $547-$558 (EMA 55/SMA50D/EMA 21 cluster). Invalidation: close below $482. (30% probability)
- Scenario 3: Neutral Range Chop — Price oscillates between ~$480 support and ~$530 resistance as ADX stays below 25. Trigger: no closes outside $480-$530. Target: $495-$515. Invalidation: close beyond either boundary. (20% probability)
PRICE TARGETS
- Target Price: $487.00 (27-day horizon, about -3.5% from the current price)
- Expected Range: $447.00 to $527.00 (width $80 = ~15.8% of current price, consistent with the 30-60 day guidance of 12-18% at 27 days)
- Key Levels: Support at $482.49 (lower Bollinger Band), then $450-$460. Resistance at $528.92 (VWAP), then $546.79-$557.47.
OVERALL BIAS
OVERALL BIAS: BEARISH - Price has lost EMA 21, EMA 55, SMA50D and VWAP on its largest-volume bar in the window, MACD is in a bearish crossover below zero, and −DI (37.3) dominates +DI (21.2). Weak ADX, a marginally positive CMF and the lower Bollinger Band at $482 argue for a bounce, but the weight of evidence favors a drift toward the high-$400s.
This is educational analysis and not financial advice.