SOXL 20-day neutral forecast — Nov 1, 2026
- Bias: Neutral
- Timeframe: 20 days (made Nov 1, 2026, target date Nov 20, 2026)
- Price at analysis: $77.05
- Price target: $72.50
- Expected range: $68.00 – $77.50
- Result: Pending — graded after the close on Nov 20, 2026
Get a free AI analysis of SOXL today
Analysis
TECHNICAL INDICATORS
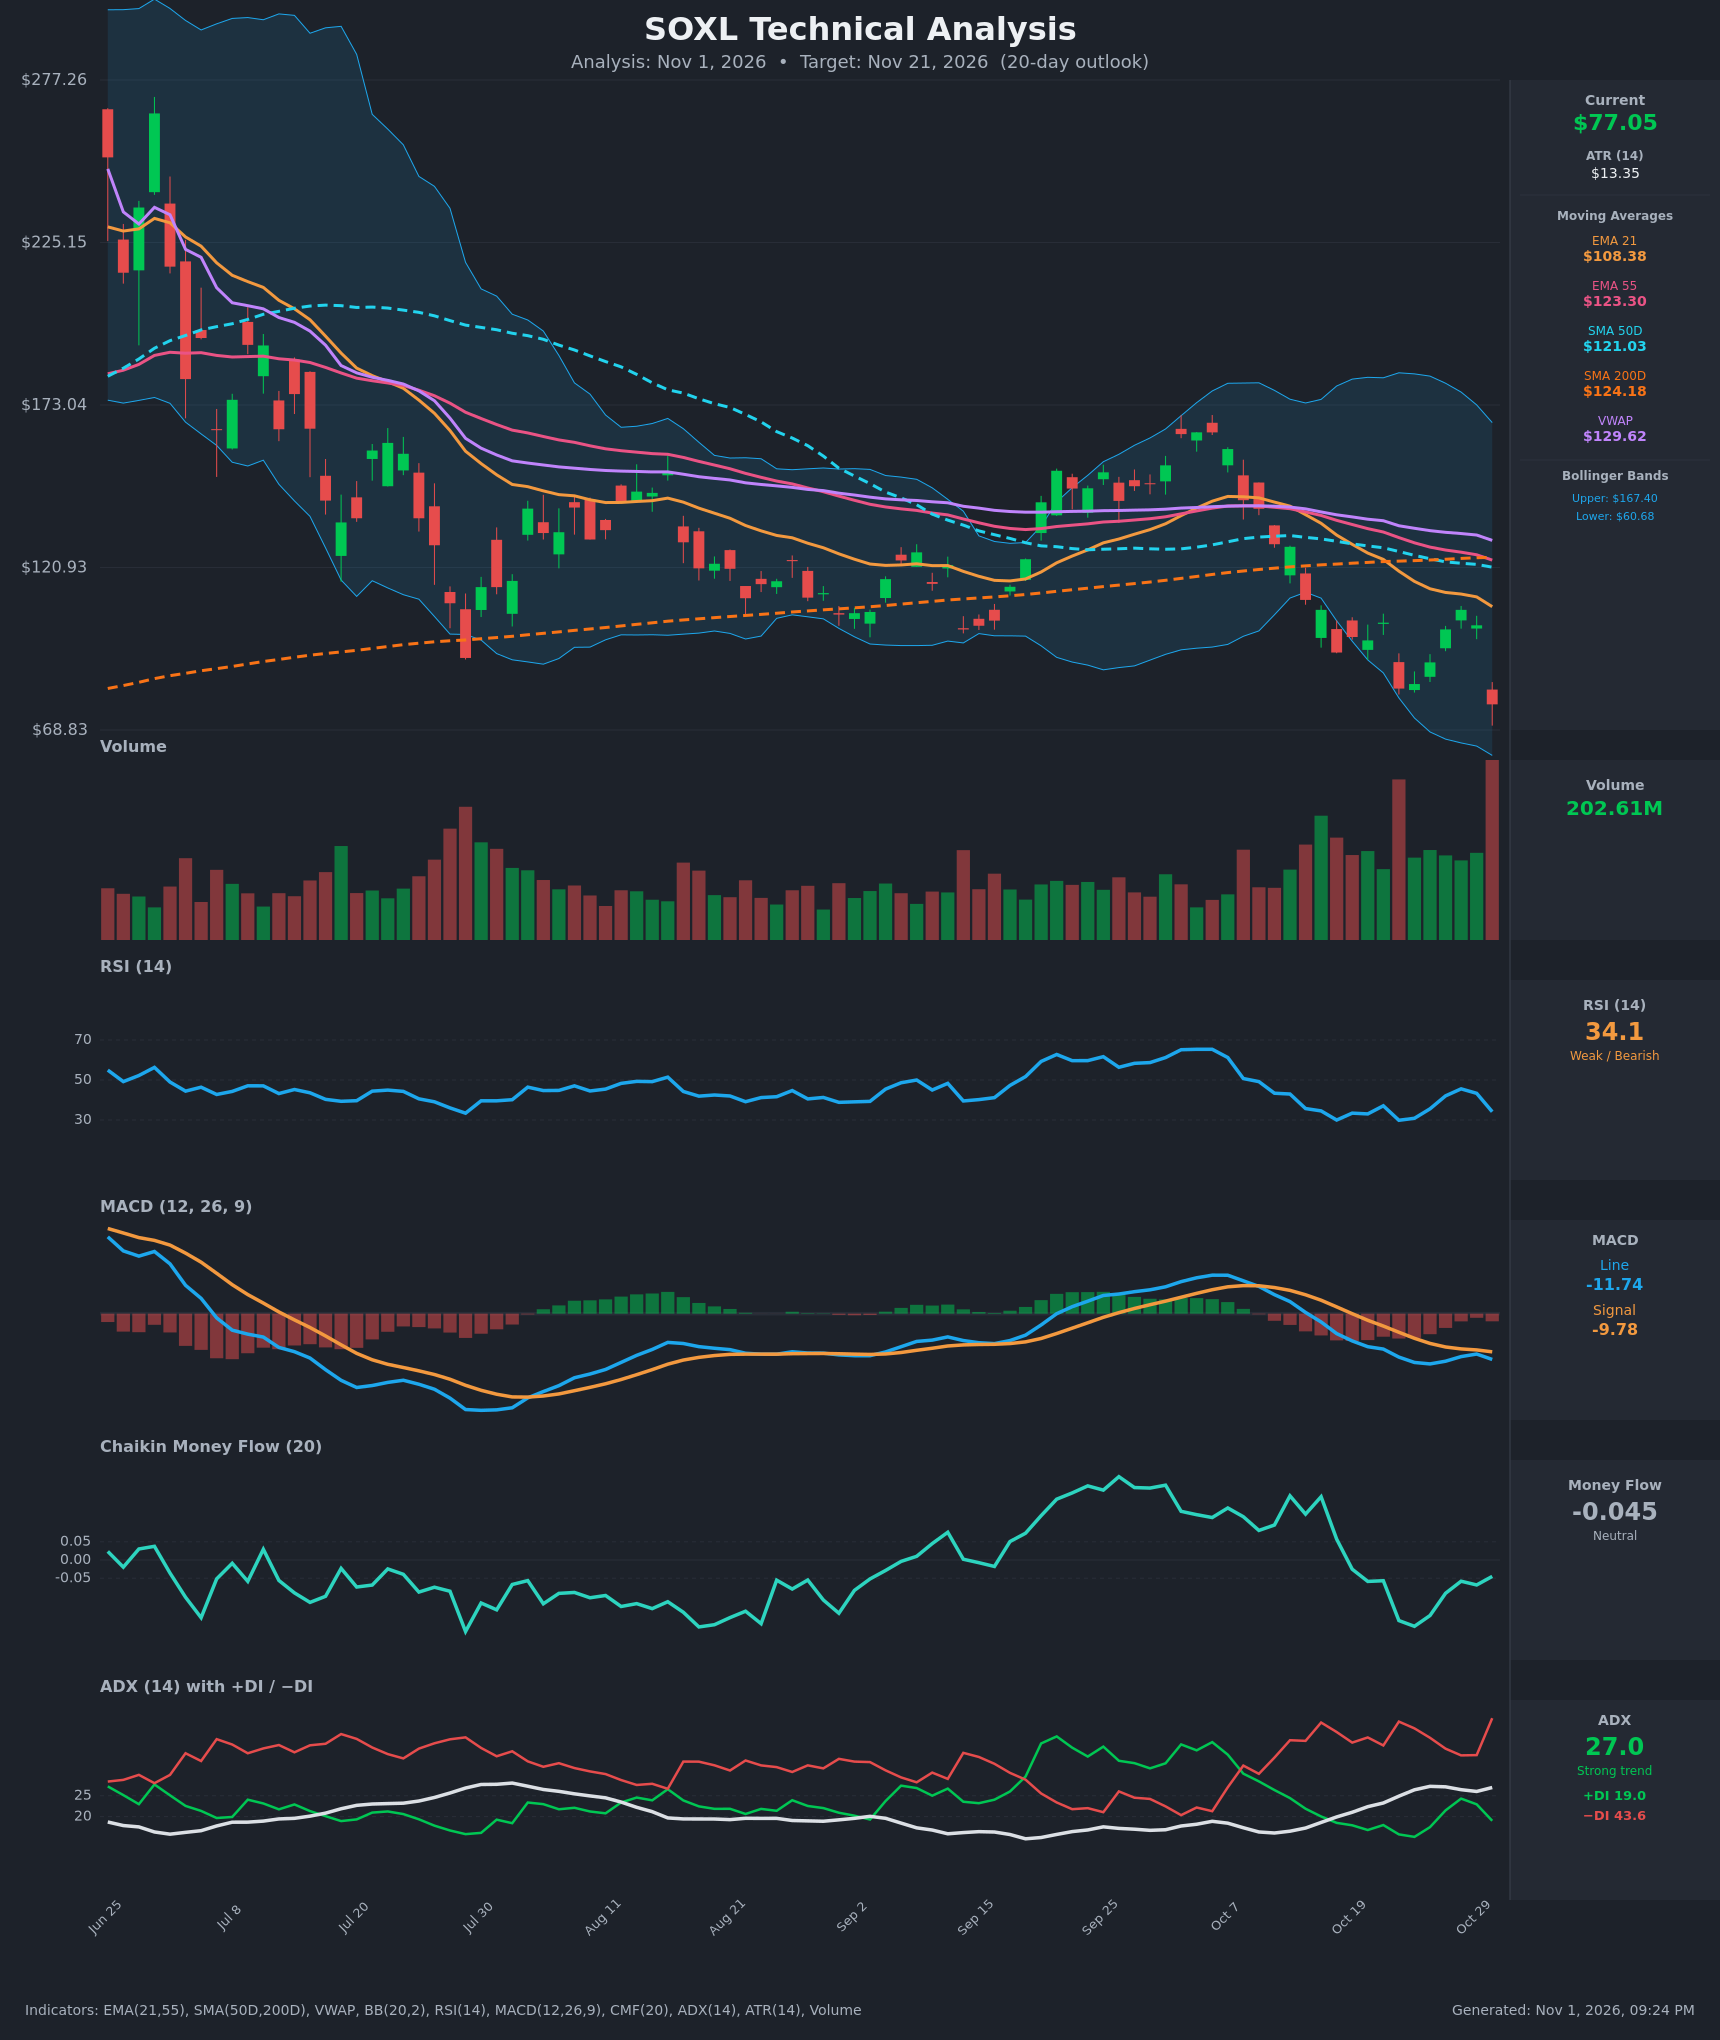
- RSI (14): 34.14, down from 45.6 on Oct 28 and approaching oversold but not there. The prior low was 29.9 on Oct 22, when price was higher (see divergence below). Momentum is weak but not yet exhausted. [Bearish]
- 20 EMA (EMA 21): $108.38, with price about 29% below it. EMA 21 is also below EMA 55 ($123.30), a bearish cross in place since around Oct 14. The EMA 21 is acting as dynamic resistance, and the Oct 28 rally failed under it. [Bearish]
- MACD: Line -11.74 is below Signal -9.78, so the histogram is negative at about -1.95. The line is below zero, and the Oct 27-28 attempt to narrow the gap has reversed. Bearish momentum is re-expanding. [Bearish]
- Bollinger Bands (20): Upper $167.40, lower $60.68, so the bands are very wide after the volatility expansion. Price at $77.05 sits in the lower third of the band, far below the midline (~$114). It is not at the lower band, so there is still room to fall before a classic band-touch bounce. [Bearish]
- CMF (20): -0.045, just inside the neutral zone. It has fallen from +0.176 on Oct 13 and is drifting toward distribution (below -0.05). [Neutral]
- ADX (14): 27.0 and rising, which means a strong trend. −DI (43.6) is far above +DI (19.0), so sellers are firmly in control. [Strong Trend – Bearish]
- Volume: 202.61M, the largest bar on the chart, on a roughly 25% single-day drop. This is heavy distribution and possibly capitulation. It confirms the breakdown, though a spike like this can also mark a short-term exhaustion low. [Bearish with exhaustion risk]
DIVERGENCES & TRENDS
- Bullish RSI divergence (minor): Price made a lower low ($77.05 vs $82.11 on Oct 22), while RSI made a higher low (34.1 vs 29.9). This hints at fading downside momentum and raises the odds of a relief bounce, but it is not confirmed by MACD or CMF.
- MACD: No divergence. The line is making lower lows with price, which confirms the trend.
- Death cross: SMA50D ($121.03) crossed below SMA200D ($124.18) around Oct 27, a major bearish trend signal. Price is also far below SMA200D, so the long-term trend is down.
- EMA structure: EMA 21 < EMA 55 < SMA50D < SMA200D < VWAP ($129.62) is a fully bearish stack.
- DI: −DI has been above +DI throughout the Oct decline, and ADX has risen from 16 to 27, so the trend is strengthening.
- CMF: It has rolled over from strong accumulation (+0.18) to neutral/negative, a shift in money flow that supports the downtrend.
- Failed bounce: The rally from $82 to $107 stalled below EMA 21, and Oct 30 erased it completely with a lower low.
CHART PATTERNS
- Bearish Flag / Rising Wedge (continuation): The Oct 22-29 rebound from ~$82 to ~$107 formed a weak counter-trend bounce that broke down sharply on Oct 30. This resembles the Bearish Flag/Pennant from the reference diagram. The flagpole (~$128 to ~$82, about $46) projects far below, but a full measured move is unlikely within 20 days.
- Broader structure: Since June, price has made a series of lower highs and lower lows below falling moving averages, a persistent downtrend channel. The Sep-Oct rally failed at the cluster of EMA 55, SMA50 and SMA200 near $140, which is textbook resistance.
- No bullish reversal pattern is confirmed yet. A double bottom against the Oct 22 low (~$82) is invalid because price broke it.
POTENTIAL SCENARIOS
- Scenario 1: Bearish Trend Continuation — The downtrend persists with bears dominating (−DI 43.6 vs +DI 19.0, death cross, full bearish MA stack). Price drifts or slides toward the $68-$70 area, probing the chart low. Trigger: failure to reclaim ~$83.56 and a daily close below $72. Target: $68-$72 (extreme case toward the lower BB at ~$60.68). Invalidation: daily close above $90.50. (50% probability)
- Scenario 2: Bullish Relief Bounce — The heavy-volume capitulation bar and the RSI higher-low divergence trigger a short-covering bounce, as happened after the Oct 22 low. Price retraces toward the broken support/gap area. Trigger: close above $83.56 with RSI turning up through 40. Target: $90-$100 (EMA 21 at ~$108 is the ceiling). Invalidation: close below $68.83. (35% probability)
- Scenario 3: Neutral Volatile Base — Price chops between ~$68 and ~$84 as sellers exhaust, with ADX flattening. Trigger: successive closes between $70 and $82. Target: $75-$78. Invalidation: close outside $66-$90. (15% probability)
PRICE TARGETS
- Target Price: $72.50 (20-day, about 5.9% below current)
- Expected Range: $68.00 to $77.50 (width $9.50, about 12.3% of current price, consistent with the 14-21 day guidance)
- Key Levels: Support at $68.83, Resistance at $83.56
The range follows the formula, but SOXL's ATR is $13.35 (about 17% of price). Realized moves can easily exceed this range in either direction.
OVERALL BIAS
OVERALL BIAS: BULLISH/BEARISH CHECK → OVERALL BIAS: BEARISH - Price is below every moving average after a death cross, −DI dominates with a rising ADX of 27, and MACD is expanding negatively on a heavy-volume breakdown. The minor RSI divergence points to relief-bounce risk, but the evidence favors further downside.
This is educational analysis and not financial advice.