IBM 27-day bullish forecast — Nov 1, 2026
- Bias: Bullish
- Timeframe: 27 days (made Nov 1, 2026, target date Nov 27, 2026)
- Price at analysis: $257.81
- Price target: $263.50
- Expected range: $240.00 – $281.00
- Result: Pending — graded after the close on Nov 27, 2026
Get a free AI analysis of IBM today
Analysis
TECHNICAL INDICATORS
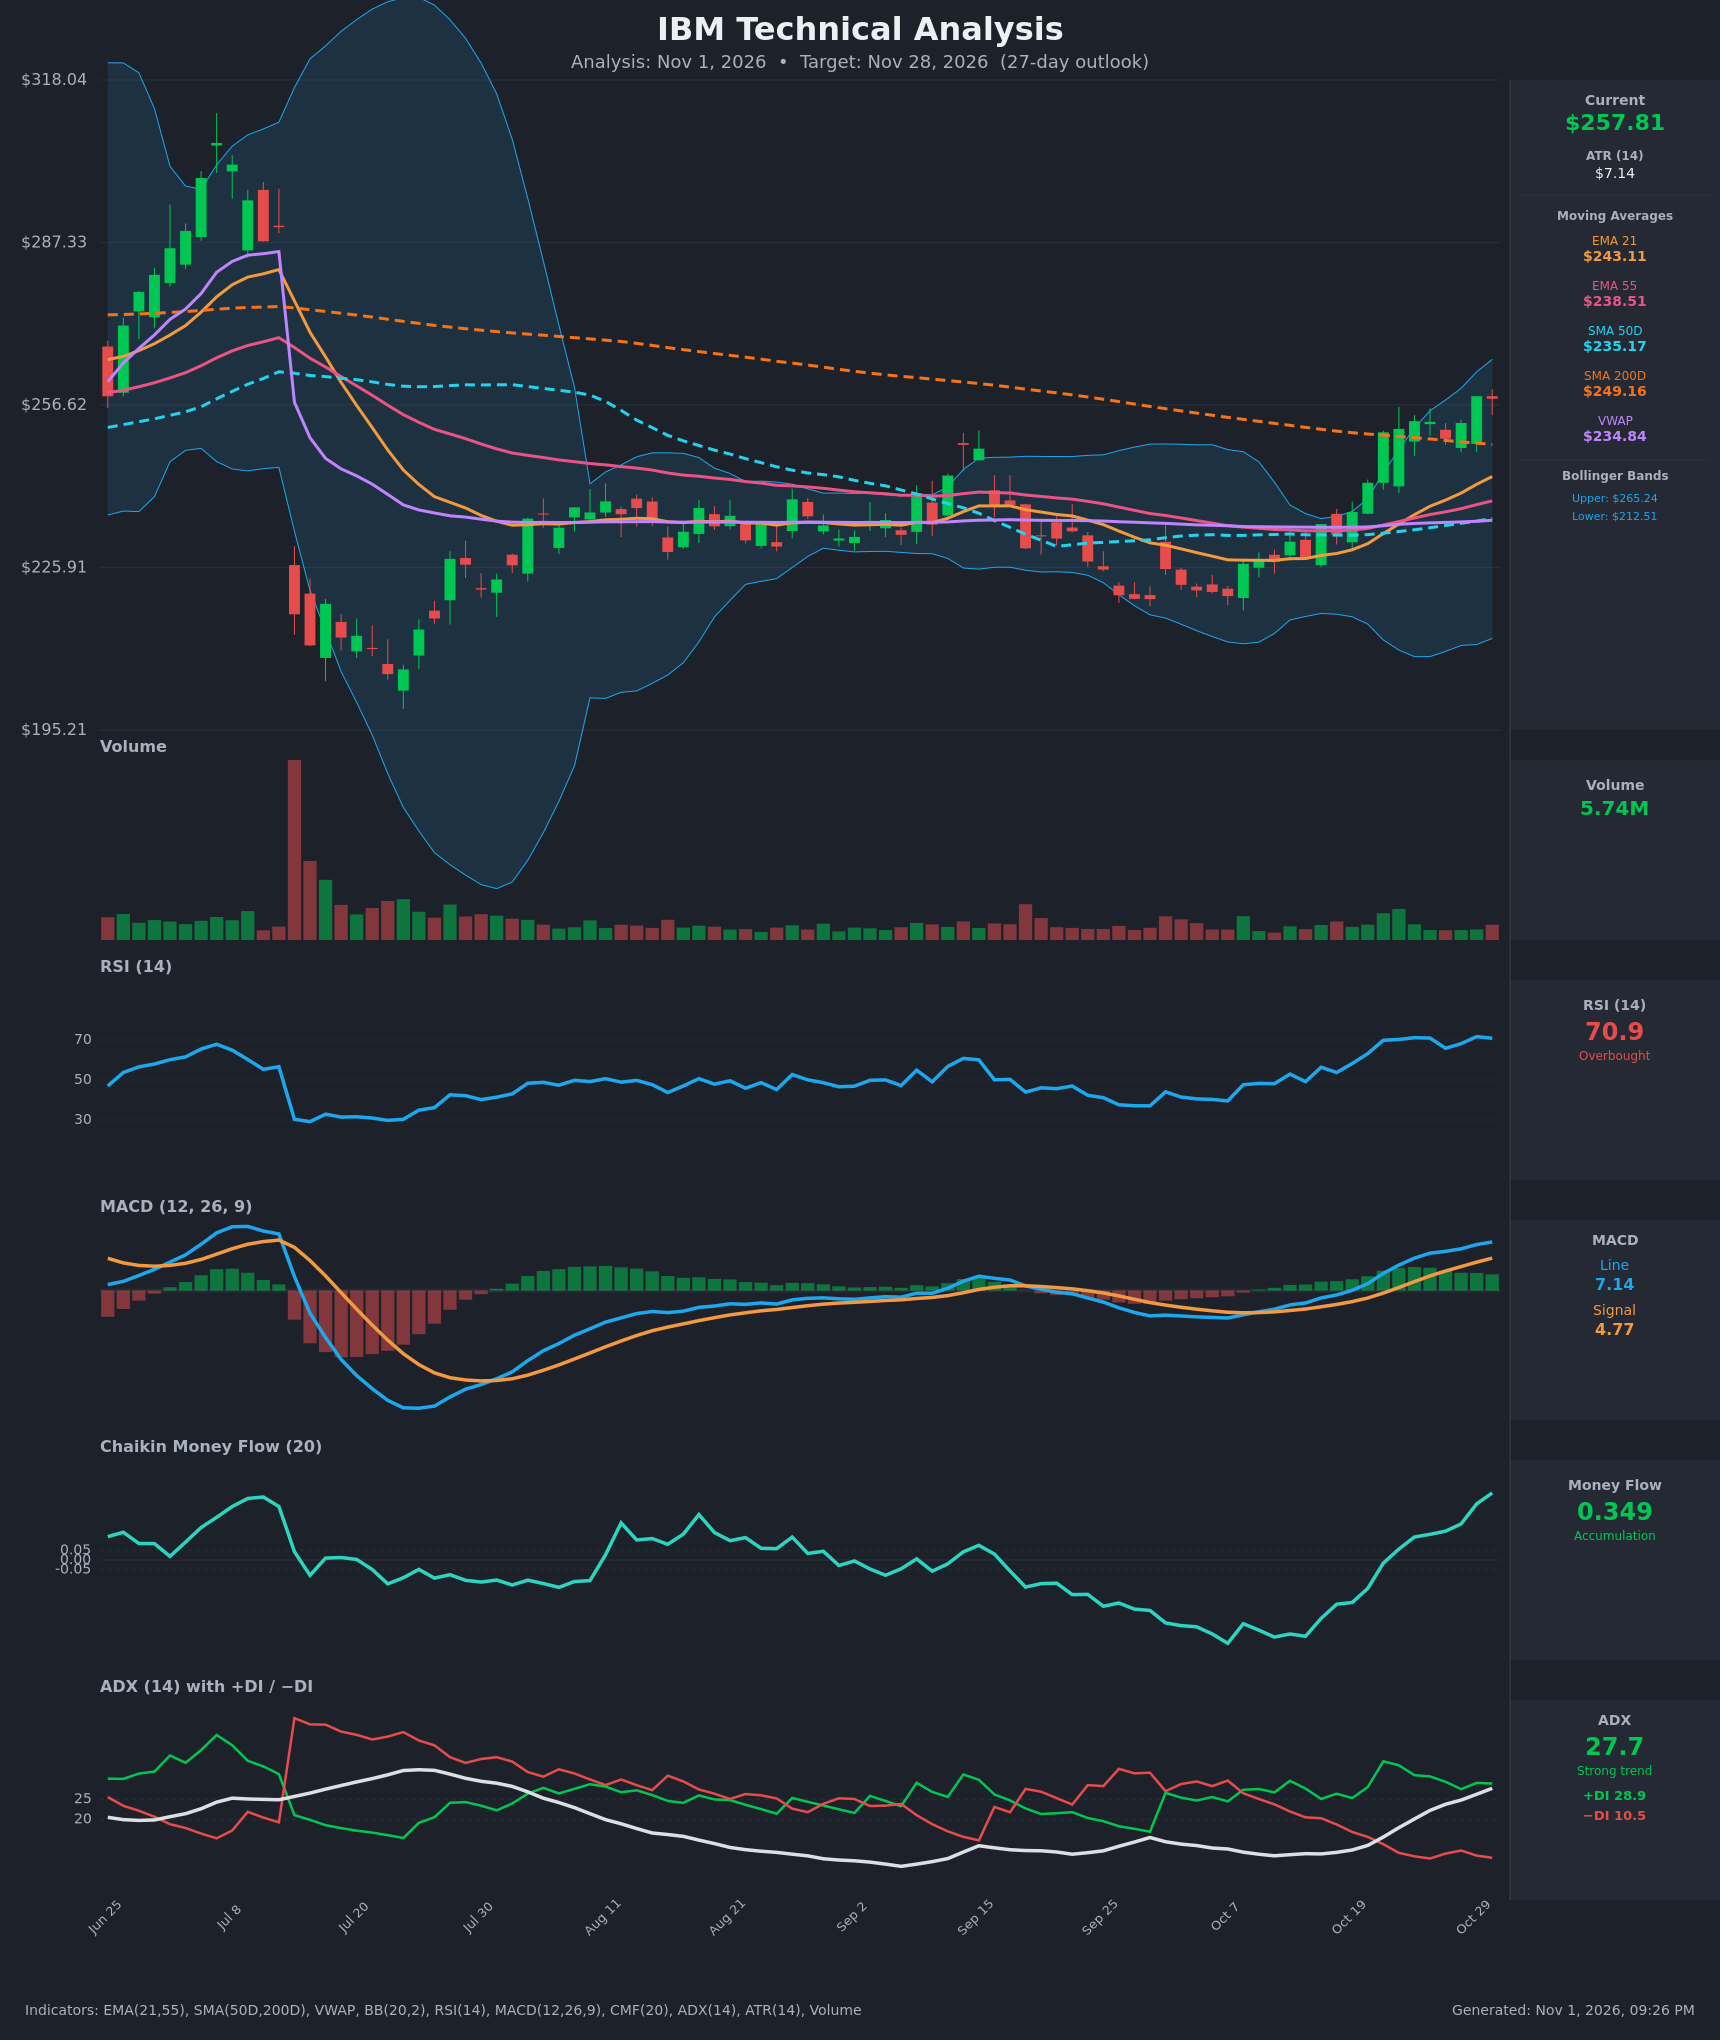
- RSI (14): 70.89, just into overbought. It has held around 70-71 for about a week (69.9 on Oct 21, 71.7 on Oct 29) after rising from 48 on Oct 12. Momentum is strong but stretched, and a plateau at 70 often precedes a pause. [Bullish]
- 20 EMA: The supplied value is the EMA 21 at $243.11, with price at $257.81, about 6% above it. The EMA 21 is rising steeply and has crossed above the EMA 55 ($238.51). The EMA 21 is a dynamic support area, though price is extended from it. [Bullish]
- MACD: The line is 7.14 against a signal of 4.77, a positive histogram of about 2.4 that is still widening. The bullish crossover happened around Oct 19-22 and has since extended above zero. [Bullish]
- Bollinger Bands (20): Upper $265.24, lower $212.51, so price sits in the upper quarter of the band and about $7.4 below the upper band. The bands are wide because of the July selloff still in the window, which makes the lower band stale. The recent band expansion and the walk up the upper half show strength, though price is near the upper band, a typical pause zone. [Bullish]
- CMF (20): 0.349, a strong accumulation reading that has risen from -0.40 on Oct 12 to a positive reading on Oct 22 and has kept climbing. Buying pressure is clearly dominant. [Accumulation]
- ADX (14): 27.7 and rising from 11 on Oct 12, so a new trend is establishing. +DI is 28.9 against −DI at 10.5, a wide gap that shows bulls firmly in control. [Strong Trend + Bullish]
- Volume: 5.74M, which is unremarkable. The breakout bars on Oct 20-21 had somewhat elevated volume, but recent volume has been modest, so the move is supported by CMF but not by a heavy volume surge. [Neutral to mildly supportive]
DIVERGENCES & TRENDS
- No bearish RSI divergence yet: RSI is flat near 71 while price made a marginal new high at $258.28 on Oct 29, then slipped slightly to $257.81. This is something to watch.
- MACD and CMF are both making new highs alongside price, confirming the advance.
- Price is above the EMA 21, EMA 55, SMA 50D, and VWAP ($234.84, about 10% below price). The close is also above the SMA 200D ($249.16). The SMA 200D has been rolling over, and price is now testing and has pushed above it.
- The EMA 21 crossed above the EMA 55 recently. A golden cross between the SMA 50D ($235.17) and SMA 200D ($249.16) has not happened, but the gap is closing at roughly $14 and narrowing.
- ADX rising from a very low base to 27.7 shows a transition from a range to a trend.
- The extension is the main risk: the stock gained about 13.6% in 13 sessions. Price is far from VWAP and the 21 EMA, so a pullback or consolidation is plausible even within an uptrend.
CHART PATTERNS
- The stock spent from August to mid-October in a broad base, roughly $215-$245. The breakout through the top of that range in the last two weeks resembles a Bullish Triple Top-style or range breakout from the diagram, where a multi-touch ceiling gives way. It resembles a rounded base more than a textbook match.
- There is also a hint of a Bullish Inverted Head and Shoulders-type recovery shape: the post-July low near $205-$210, then a higher low in October around $217-$220, followed by a breakout. This is loose, not exact.
- A measured move from the $245 breakout area using a base height of about $30 projects toward $275. Overhead resistance is the SMA 200D at about $249 (now being reclaimed), then the upper Bollinger Band near $265, then the July gap-down zone at $270-$285.
- Overhead supply sits at the July gap ($270-$285), which limits the upside over 27 days.
POTENTIAL SCENARIOS
- Scenario 1: Bullish Trend Continuation — Strong ADX, +DI dominance, CMF accumulation, and a MACD expansion keep buyers in control after the base breakout. Price consolidates briefly above the SMA 200D and then pushes through the upper band. Trigger: daily close above $265 (upper band) and above the Oct 29 high of $258.28. Target: $270-$278. Invalidation: close below $245 (EMA 21 and breakout area). (50% probability)
- Scenario 2: Bullish Pullback and Grind Higher — RSI at 70 and price extended 6% above the EMA 21 prompt a retracement toward the SMA 200D / EMA 21 zone, followed by a resumption of the uptrend. Trigger: a pullback to $245-$250 that holds on lower volume. Target: $262-$268 by the end of the period. Invalidation: close below $240. (30% probability)
- Scenario 3: Bearish Failed Breakout — Overbought RSI and price rejection at the declining SMA 200D and overhead supply lead to a failed breakout and a retreat into the old range. Trigger: close below $243 with MACD histogram rolling over. Target: $232-$238 (SMA 50D, VWAP). Invalidation: close above $266. (20% probability)
PRICE TARGETS
- Target Price: $263.50 (27 days)
- Expected Range: $240.00 to $281.00 (width $41, about 15.9% of current price, consistent with the 12-18% guidance for 30-60 days, scaled down slightly for 27 days)
- Key Levels: Support at $249.16 (SMA 200D, reclaimed), with deeper support at $243.11 (EMA 21). Resistance at $265.24 (upper Bollinger Band), then $278.
OVERALL BIAS
OVERALL BIAS: BULLISH - A fresh trend is forming: ADX is rising to 27.7 with +DI far above −DI, the MACD is positive and widening, CMF at +0.35 shows strong accumulation, and price has broken out of a two-month base and above the SMA 200D. Overbought RSI and extension from the EMA 21 may cause a pause, but the evidence favors higher prices over 27 days.
This is educational analysis and not financial advice.